The Linux Scheduler: a Decade of Wasted Cores
文章分析了几个Linux Scheduler里面的几个缺陷,分析了造成这些缺陷的原因,以及他们设计发现这些缺陷的工具(一个invariant检查工具类似assert, 一个是可视化调度工具这个好像用途比较大)。文章里面好多东西也看不太懂,本来读Paper这件事情就是凭缘分吧。
The main contribution of this work is the discovery and analysis of these bugs and providing the fixes. Conventional testing techniques and debugging tools are in- effective at confirming or understanding this kind of bugs, because their symptoms are often evasive. To drive our in- vestigation, we built new tools that check for violation of the invariant online and visualize scheduling activity. They are simple, easily portable across kernel versions, and run with a negligible overhead. We believe that making these tools part of the kernel developers’ tool belt can help keep this type of bug at bay.
在2000之前大部分人和Linus Torvalds意见差不多,都认为Linux Scheduler是个非常简单/稳定的东西。但是随着多核以及NUMA出现,Scheduler似乎就不不再是个简单的问题,如何充分利用多核/NUMA对Scheduler提出了巨大的挑战,当然也就引入了许多缺陷。所有这些缺陷原因各异,但是现象就是runqueue里面有任务,但是某些cores还是处于idle状态。
“And you have to realize that there are not very many things that have aged as well as the scheduler. Which is just another proof that scheduling is easy.” – Linus Torvalds, 2001 [43]
Classical scheduling problems revolve around setting the length of the scheduling quantum to provide interactive re- sponsiveness while minimizing the context switch overhead, simultaneously catering to batch and interactive workloads in a single system, and efficiently managing scheduler run queues. By and large, by the year 2000, operating systems designers considered scheduling to be a solved problem; the Linus Torvalds quote is an accurate reflection of the general opinion at that time.
Year 2004 brought an end to Dennard scaling, ushered in the multicore era and made energy efficiency a top concern in the design of computer systems. These events once again made schedulers interesting, but at the same time increas- ingly more complicated and often broken.
Our recent experience with the Linux scheduler revealed that the pressure to work around the challenging properties of modern hardware, such as non-uniform memory access latencies (NUMA), high costs of cache coherency and syn- chronization, and diverging CPU and memory latencies, re- sulted in a scheduler with an incredibly complex implemen- tation. As a result, the very basic function of the scheduler, which is to make sure that runnable threads use idle cores, fell through the cracks.
These bugs have different root causes, but a common symptom. The scheduler unintentionally and for a long time leaves cores idle while there are runnable threads waiting in runqueues. Short-term occurrences of this condi- tion are acceptable: the system may temporarily enter such a state when, for instance, a thread exits or blocks or when a thread is created or becomes unblocked. Long-term occur- rences are not an expected behavior. The Linux scheduler is work-conserving, meaning that it should never leave cores idle if there is work to do. Long-term presence of this symp- tom is, therefore, unintentional: it is due to bugs and it hurts performance.
Linux Scheduler默认算法是CFS(Completely Fair Scheduling). 在单核情况下面这个算法比较简单,但是在多核以及NUMA环境下面,CFS就变得很复杂需要考虑许多情况。load balance算法会考虑每个核上的运行情况,然后决定是否需要在多个核之间进行迁移。
Therefore, what Linux and most other schedulers do is pe- riodically run a load-balancing algorithm that will keep the queues roughly balanced.
“I suspect that making the scheduler use per-CPU queues together with some inter-CPU load balancing logic is probably trivial . Patches already exist, and I don’t feel that people can screw up the few hundred lines too badly.” — Linus Torvalds, 2001 [43]
因为多核有不同的性质(share L2 cache, share L3 cache, socket, NUMA),根据这些性质引入了scheduling domain概念,大约就是一个domain下面某些core的性质是相似的。
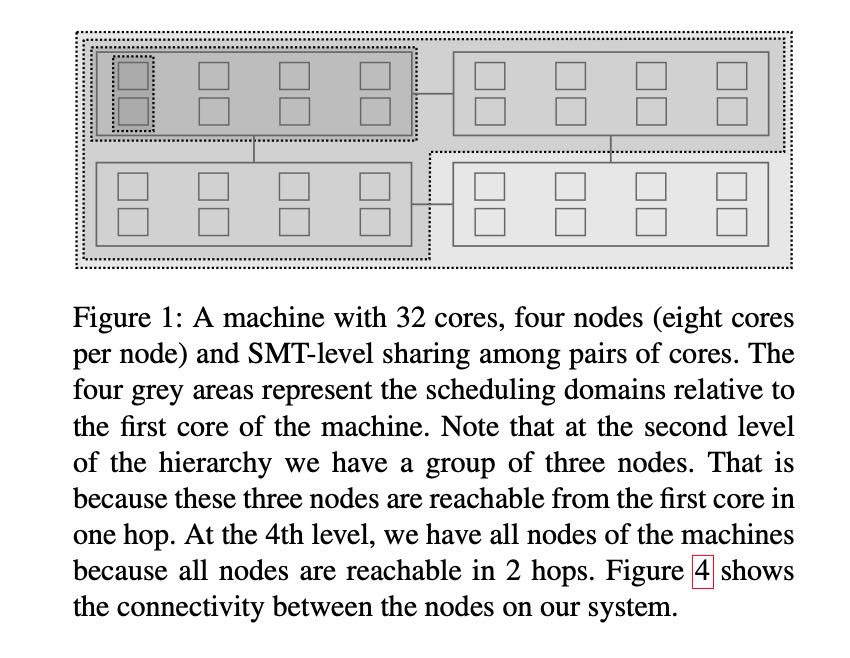
The cores are logically organized in a hierarchy, at the bottom of which is a single core. How the cores are grouped in the next levels of the hierarchy depends on how they share the machine’s physical resources. In the example pro- vided here we describe the hierarchy on our experimental machine (see Table 5), where pairs of cores share functional units (e.g., FPU), and groups of eight cores share a last-level cache (LLC). A group of eight cores sharing an LLC form a NUMA node. Different NUMA nodes have varying connec- tivity as explained below and as shown in Figure 4. Conse- quently, on our target system, at the second level of the hier- archy we have pairs of cores, and at the next level we have groups of eight cores, each sharing an LLC (e.g., a NUMA node). NUMA nodes are further grouped according to their level of connectivity [23]. Nodes that are one hop apart from each other will be at the next level, and so on. An example of such a hierarchy is shown in Figure 1. Each level of the hierarchy is called a scheduling domain.
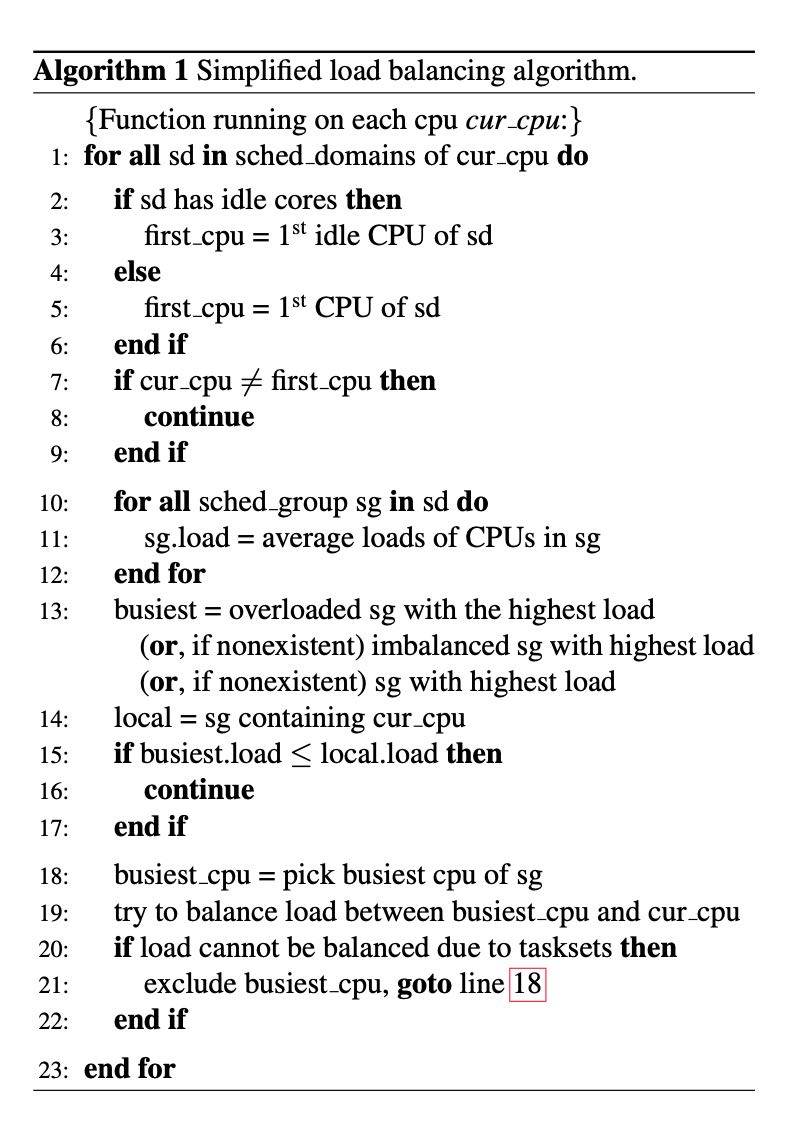
简化之后的load balancing算法如下,大约就是从每个SG里面选择一个代表CPU,然后这个CPU对这个SG里面的CPU runqueue进行负载均衡。
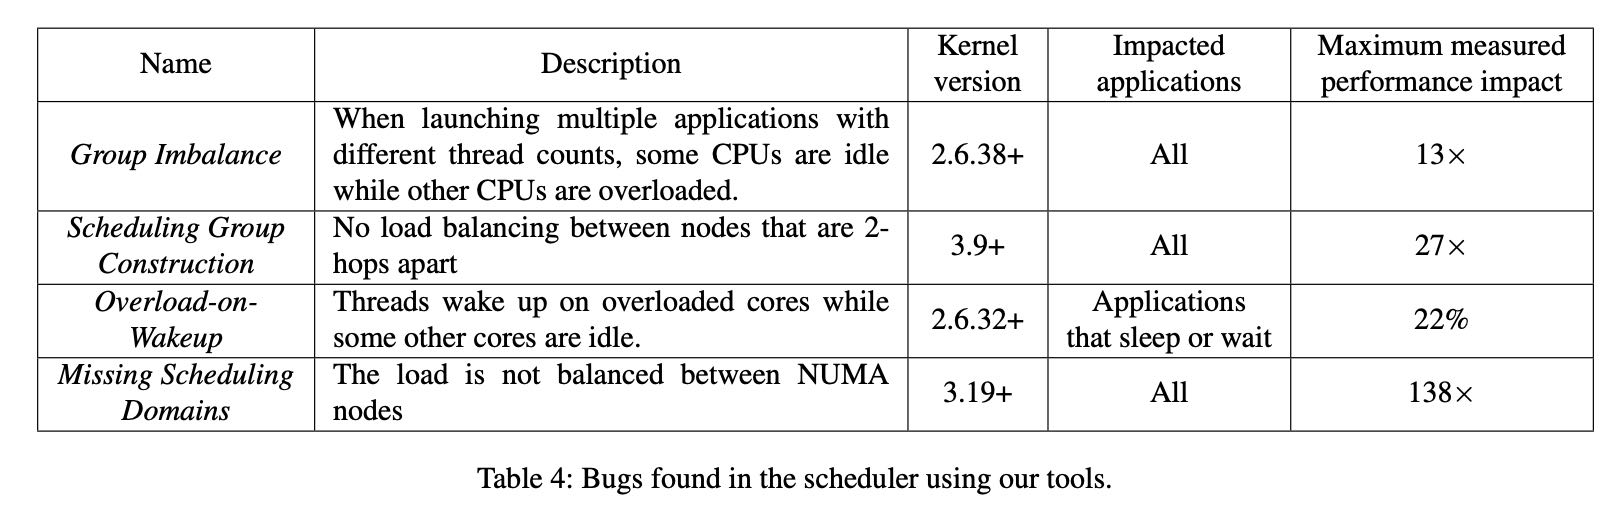
文章作者发现的几个bugs如下,这些bugs我没有仔细看
Linux Scheduler经历过多次重新设计和实现,并且为了适配新的硬件以及运行环境,做了许多改进/牺牲。未来可以预见到,其他的设计和实现也会不断地被提出来,同时bugs也会不断地被引入。scheduler这个东西的bugs比较隐秘,它不会造成crash, 也很拿通过类似sampling的方式来观察到,必须使用tracing的方式来发现,还有就是复现这些问题的workload(单一的workload可能没有办法复现,必须是多个applications同时运行),这个就给测试以及回归造成很大的困难。
The Linux scheduler has gone through a couple ma- jor redesigns. The original scheduler had high algorithmic complexity, which resulted in poor performance when highly multithreaded workloads became common. In 2001, it was replaced by a new scheduler with O(1) complexity and bet- ter scalability on SMP systems. It was initially successful but soon required modifications for new architectures like NUMA and SMT. At the same time, users wanted better support for desktop use cases such as interactive and audio applications which required more changes to the scheduler. Despite numerous modifications and proposed heuristics, the O(1) scheduler was not able to meet expectations and was replaced by CFS in 2007. Interestingly, CFS sacrifices O(1) complexity for O(log n) but it was deemed worthwhile to provide the desired features.
As the hardware and workloads became more complex, CFS too succumbed to bugs. The addition of autogroups coupled with the hierarchical load balancing introduced the Group Imbalance bug. Asymmetry in new, increasingly more complex NUMA systems triggered the Scheduling Group Construction bug. “NUMA-ness” of modern sys- tems was responsible for the Missing Scheduling Domains bug. Cache-coherency overheads on modern multi-node ma- chines motivated the cache locality optimization that caused the Overload-on-Wakeup bug.
The takeaway is that new scheduler designs come and go. However, a new design, even if clean and purportedly bug- free initially, is not a long-term solution. Linux is a large open-source system developed by dozens of contributors. In this environment, we will inevitably see new features and “hacks” retrofitted into the source base to address evolving hardware and applications.
Kernel developers rely on mutual code review and testing to prevent the introduction of bugs. This could potentially be effective for bugs like the Missing Scheduling Domains and Scheduling Group Construction that are easier to spot in the code (of course, it still was not effective in these cases), but it is unlikely to be reliable for the more arcane types of bugs.
Catching these bugs with testing or conventional perfor- mance monitoring tools is tricky. They do not cause the system to crash or to run out of memory, they silently eat away at performance. As we have seen with the Group Im- balance and the Overload-on-Wakeup bugs, they introduce short-term idle periods that “move around” between dif- ferent cores. These microscopic idle periods cannot be no- ticed with performance monitoring tools like htop, sar or perf. Standard performance regression testing is also un- likely to catch these bugs, as they occur in very specific situa- tions (e.g., multiple applications with different thread counts launched from distinct ttys). In practice, performance test- ing on Linux is done with only one application running at a time on a dedicated machine – this is the standard way of limiting factors that could explain performance differences.
In summary, conventional testing techniques and debug- ging tools were not helpful to us in either confirming the bugs, after we initially suspected them, or understanding their root causes. Our experience motivated us to build new tools, using which we could productively confirm the bugs and understand why they occur. The following section de- scribes the tools.
作者在文章中提到两个工具:1. online sanity checker. 2. scheduler visualization tool. https://github.com/jplozi/wastedcores
第一个sanity checker主要是判断:是否有某些CPU是在空转,而其他CPU的run queue里面还有任务。我们可以容忍这个时间出现比如100ms, 如果超过100ms的话那么认为scheduler里面有某些问题。
Our sanity checker is different from an assertion or a watchdog in that, in our case, it must be specifically tailored to check for conditions that are acceptable for a short pe- riod of time, but unacceptable if they persist. While an as- sert would fire as soon as the desired invariant is violated, a sanity checker must minimize the probability of flagging short-term transient violations, and catch long-term viola- tions with a high probability.
第二个scheduler visualizaton tool使用tracing的方法记录:每个core上的run queues以及load, 还另外记录那些cores在load balancing阶段被选中。event可以被很紧凑地记录起来,64cores下面大约每秒使用3.6MB的内存。
Our visual tool makes it possible to profile and to plot (1) the size of run queues, (2) the total load of run queues, and (3) the cores that were considered during periodic load balancing and thread wake- ups. In order to provide maximum accuracy, it does not use sampling, instead, it records every change in the size of run queues or load, as well as a set of considered cores at each load rebalancing or thread wakeup event. To keep the over- head low, we store all profiling information in a large global array in memory of a static size. Each element of this array is an event that corresponds to either (1), (2), or (3):
- For (1), we instrument kernel functions add nr running and sub nr running, which are the only functions that directly alter the variables that stores the size of each run queue. In these functions, we store an event in our global array that contains a timestamp, the core number, and the new runqueue size.
- Similarly, for (2), we instrument kernel functions account entity enqueue and account entity de- queue, which are the only functions that directly alter the variables that store the load of each run queue. In these functions, we store an event in our global array that con- tains a timestamp, the core number, and the new load.
- Finally, for (3), we instrument kernel functions select idle sibling, update sg lb stats, find - busiest queue and find idlest group. In these functions, we store an event in our global array that contains a timestamp, as well as a bit field with 0’s for cores that were not considered during the operation, and 1’s for cores that were.