Performance Analysis and Tuning on Modern CPUs
Table of Contents
https://book.easyperf.net/perf_book
1. CPU流水线
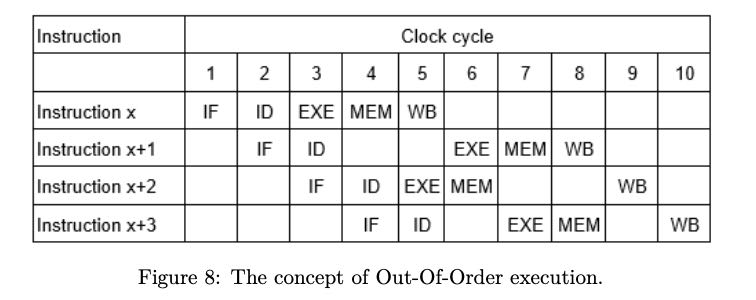
因为有推测执行功能,所以实际执行的指令,比最后commit的指令是要更多的。我们把实际实行的指令叫做executed instruction, 而最后面commit的指令则叫做retired instruction. 在大部分性能分析工具中,我们看到的instructions, 应该就是retired的,因为这个部分才是真正对外visible的。
CPU基本流水线分为下面5个步骤:
- Instruction fetch (IF)
- Instruction decode (ID)
- Execute (EXE)
- Memory access (MEM)
- Write back (WB)
下面几个因素/风险会阻碍流水线,降低retired instruction的速度:
- structural hazard 使用相同的资源造成的危险
- data hazard 因为数据依赖造成的危险,包括:
- read-after-write: y = x + 1; z = y + 1; 使用bypassing以及OOO技术来解决
- write-after-read: y = x + 1; x = z + 1; 使用寄存器重命名来解决
- write-after-write: y = x + 1; y = z + 1; 使用寄存器重命名来解决
- control hazard 分支代码造成的危险,可以使用推测执行来解决
为了减少流水线的block, 提升ILP(instruction level parallelism), CPU上发展了众多技术解决这些hazard。基本上也可以认为,在CPU上发展出来的各种各样的技术,本质上都是为了解决流水线问题和提升ILP设计出来的。
现代CPU的流水线还是超标量(superscalar)的,也就是可以同时执行多条指令。在某个时期,Intel CPU设计出一种叫做VLIW(verl long instruction word)的架构,也就是Intel Itanium。 它试图将可以同时执行的多条指令放在一起,而如何选择可以同时执行的多条指令的工作则交给编译器来完成。但是这种工作会加重编译器的负担,编译器本身也没有办法可以很好地选择那些指令可以很好地并行执行,所以据说这个架构不是特别成功。
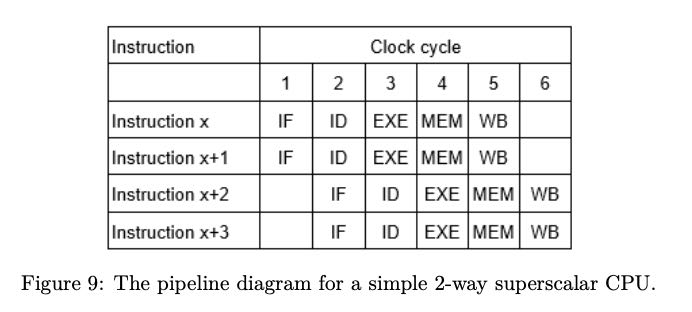
x86指令级是CISC的,但是在内部执行的时候,会将这些指令按照RISC风格的更短小指令来执行,这些更加短小的指令或者是操作就叫做uops(micro-ops). 单纯地引入uops还不够,在设计上还将一个pipeline分成了多个slots, 每个slot相当于一个uops的流水线。几乎现代的CPU的pipeline宽度都是4,也就是说有4个slots(4-wide). 这种pipeline slots可以认为更加细粒度的超标量。但是x86在执行期间,可能会将多个uops融合在一起去执行, 通常能够融合在一起的uops使用的是不同的执行功能。融合在一起的uops被当做一条指令执行,在retired阶段也被当做一条指令输出。
2. Intel Skylake
Intel Skylake的具体配置如下,从中可以看到典型的CPU设计参数:
- 内部被解码成为uops执行
- 8路超标量,支持OOO
- L1I, L1D 都是8路32KB,L2是8路1MB
- L1,L2都是独立于每个core的。
通常来说cache line size是64Bytes。通常L1, L2都是独立于每个core的,访问延迟相比L3会更低,所以许多cache locality的优化都着眼于L2而不是L3.
下面是Intel Skylake的内部结构图
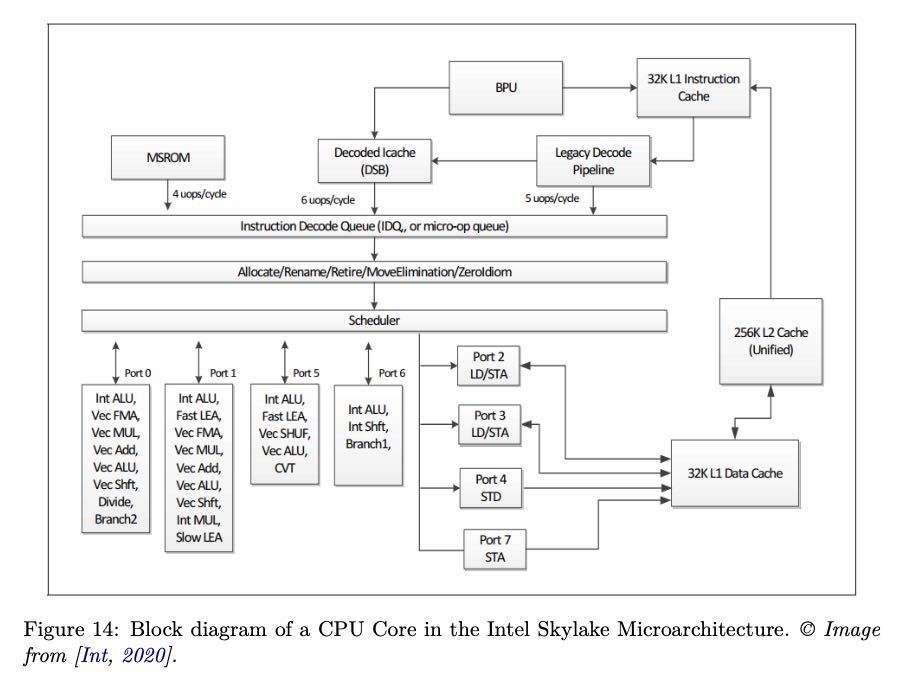
The block diagram in figure 14 shows the details of Intel’s 6th generation core, Skylake, that was announced in 2015 and is widely spread all over the world. The Skylake core is split into an in-order front-end that fetches and decodes x86 instructions into u-ops and an 8-way superscalar, out-of-order backend.
The core supports 2-way SMT. It has a 32KB, 8-way first-level instruction cache (L1 I-cache), and a 32KB, 8-way first-level data cache (L1 D-cache). The L1 caches are backed up by a unified 1MB second-level cache, the L2 cache. The L1 and L2 caches are private to each core.
CPU的设计分为front-end和back-end. front-end专注在取指令和解码,而back-end专注在执行和内存操作上。我摘录了书中一些我看的懂的内容,即便如此有些东西也是似懂非懂。 之前接触到的CPU方面的术语集中在backend上,比如ROB, RS. ROB管理了指令执行的相互依赖以及寄存器重命名,它确保retired的顺序是程序执行顺序。RS则负责资源管理,一旦uop需要使用的资源可用, 那么RS就可以安排uop进行执行,根据uop使用到的资源被提交到不同的port上。
Front-End
The CPU Front-End consists of a number of data structures that serve the main goal to efficiently fetch and decode instructions from memory. Its main purpose is to feed prepared instructions to the CPU Back-End, which is responsible for the actual execution of instructions.
The CPU Front-End fetches 16 bytes per cycle of x86 instructions from the L1 I-cache. This is shared among the two threads, so each thread gets 16 bytes every other cycle. These are complex, variable-length x86 instructions. The pre-decode and decode stages of the pipeline convert these complex x86 instructions into micro Ops (UOPs, see section 4.4) that are queued into the Allocation Queue (IDQ).
Back-End
The CPU Back-End employs an Out-Of-Order engine that executes instructions and stores results.
The heart of the CPU backend is the 224 entry ReOrder buffer (ROB). This unit handles data dependencies. The ROB maps the architecture-visible registers to the physical registers used in the scheduler/reservation station unit. ROB also provides register renaming and tracks speculative execution. ROB entries are always retired in program order.
The Reservation Station/Scheduler (RS) is the structure that tracks the availability of all resources for a given UOP and dispatches the UOP to the assigned port once it is ready. The core is 8-way superscalar. Thus the RS can dispatch up to 8 UOPs per cycle. As shown in figure 14, each dispatch port supports different operations:
- Ports 0, 1, 5, and 6 provide all the integer, FP, and vector ALU. UOPs dispatched to those ports do not require memory operations.
- Ports 2 and 3 are used for address generation and for load operations.
- Port 4 is used for store operations.
- Port 7 is used for address generation.
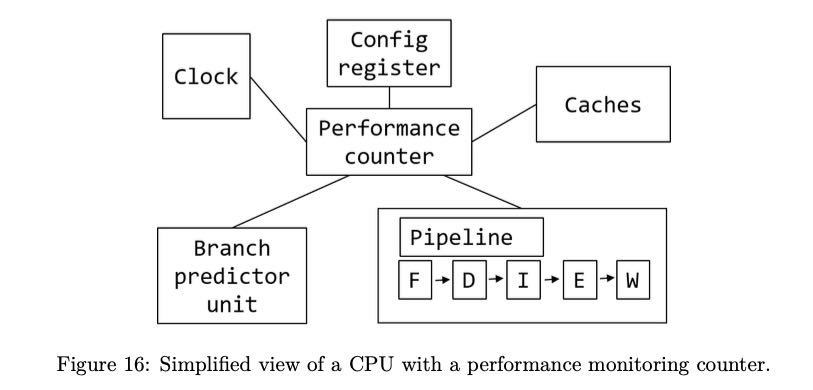
3. Performance Monitoring Counter(PMC)
CPU性能监控单元(Performance Monitoring Unit) 用来对各种CPU内部事件事件进行计数,比如分支预测,retired指令数量,cache miss等等,由此来做性能分析。 linux下面 `perf` 这样的工具,应该就使用到了PMU。下图是PMU, event, PMC以及其他特性之间的关系。
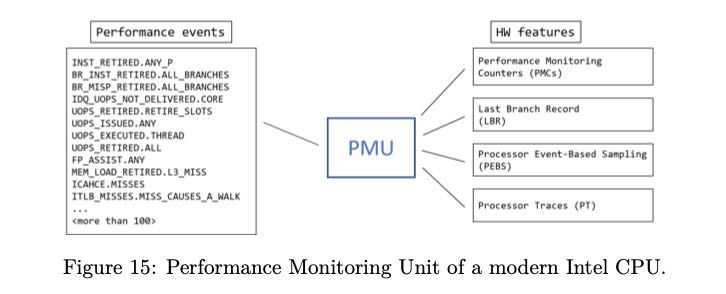
CPU的性能计数器(Performance Monitoring Counters, PMC)由几个特殊的寄存器(MSR, Model Specific Register)来实现,书上说是48bit wide, 但是因为是和 model相关的,所以其实数量和大小可能随model变化。在内核空间下面可以使用指令 `RDMSR` 和 `WRMSR` 来访问这些寄存器。
Last Branch Record是一个register ring buffer结构(capacity = 32),每次执行分支跳转的时候会记录<timestamp, from, to, predict>等信息。根据这些运行时的分支跳转信息, 可以看到:那些代码块执行时间比较长,那些地方的分支预测率比较差,那些地方的分支跳转比较多等信息。
通过 `cpuid` 工具可以查看到本地是否支持PMU。除此之外,还可以看到CPU的许多参数,是个非常好的工具。很可惜我的虚拟机什么都没有支持。
dirlt@vps:~$ cpuid
   L2 unified cache information (0x80000006/ecx):
      line size (bytes) = 0x40 (64)
      lines per tag     = 0x0 (0)
      associativity     = 8-way (6)
      size (KB)         = 0x100 (256)

   Architecture Performance Monitoring Features (0xa/eax):
      version ID                               = 0x0 (0)
      number of counters per logical processor = 0x0 (0)
      bit width of counter                     = 0x0 (0)
      length of EBX bit vector                 = 0x0 (0)
   Architecture Performance Monitoring Features (0xa/ebx):
      core cycle event not available           = false
      instruction retired event not available  = false
      reference cycles event not available     = false
      last-level cache ref event not available = false
      last-level cache miss event not avail    = false
      branch inst retired event not available  = false
      branch mispred retired event not avail   = false
   Architecture Performance Monitoring Features (0xa/edx):
      number of fixed counters    = 0x0 (0)
      bit width of fixed counters = 0x0 (0)
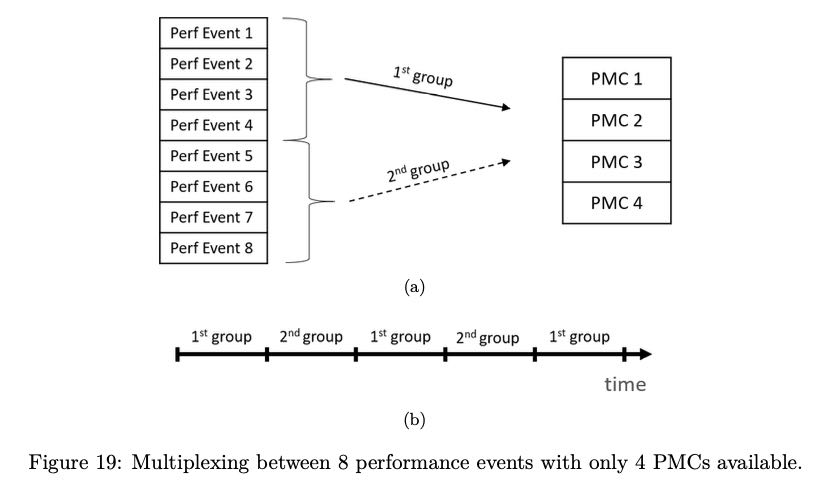
因为PMC寄存器数量有限,如果同时想查看多个events的话,那么就需要使用multiplexing + scaling events的方法,本质上就是按照比例收集各个events。
4. Dynamic Frequencey Scaling(DFS)
Dynamic Frequency Scaling(DFS),动态改变执行频率。
- 在Intel上称为"Turbo Boost"技术,设置选项是 /sys/devices/system/cpu/intel_pstate/no_turbo
- 在AMD上称为"Turbo Core"技术,设置选项是 /sys/devices/system/cpu/cpufreq/boost
下面是一个执行的例子来说明频率发生改变。
# TurboBoost enabled
$ cat /sys/devices/system/cpu/intel_pstate/no_turbo
0
$ perf stat -e task-clock,cycles -- ./a.exe
11984.691958 task-clock (msec) # 1.000 CPUs utilized 32,427,294,227 cycles # 2.706 GHz
11.989164338 seconds time elapsed

# TurboBoost disabled
$ echo 1 | sudo tee /sys/devices/system/cpu/intel_pstate/no_turbo 1
$ perf stat -e task-clock,cycles -- ./a.exe
13055.200832 task-clock (msec) # 0.993 CPUs utilized 29,946,969,255 cycles # 2.294 GHz
13.142983989 seconds time elapsed
既然有超频,那么在超频下和基准情况下面,运行某段程序得到的cpu cycles就是不同的,超频下面会更多。 我们将基准情况下面得到的cpu cycles称为reference cycles(参考cycles), 而实际运行的成为core cycles. 这样一来,turbo util = core cycles / ref cycles.
$ perf stat -e cycles,ref-cycles ./a.exe
43340884632 cycles # 3.97 GHz
37028245322 ref-cycles # 3.39 GHz
      10,899462364 seconds time elapsed
5. Simultaneous Multithreading(SMT)
Simultaneous Multithreading(SMT) 是超线程技术,在一个Core上有两个相同的架构单元比如执行流水线,但是共享某些组件比如ALU,Caches等等。 使用SMT的好处是,如果两个线程在执行的时候使用了不同的组件的话,那么更加有效地利用资源。但是使用SMT可能会对性能有不可预期的影响,所以我们有时候需要关闭SMT。
在Linux上,如果使用了SMT,那么一个物理core会被当做两个虚拟cores. 如何查看哪两个虚拟cores同属一个物理core, 可以通过选项 "sys/devices/system/cpu/cpuN/topology/thread_siblings_list" 查看。 确定虚拟cores之间的关系后,就可以将某个虚拟core关闭,这样就相当于关闭了SMT,可以通过选项 "/sys/devices/system/cpu/cpuX/online" 来关闭。此外我们也可以在BIOS里面把SMT关闭掉。
下面是一个查看关系和关闭SMT的例子。
# all 8 HW threads enabled:
$ lscpu
...
CPU(s): 8
On-line CPU(s) list: 0-7
...
$ cat /sys/devices/system/cpu/cpu0/topology/thread_siblings_list 0,4
$ cat /sys/devices/system/cpu/cpu1/topology/thread_siblings_list
1,5
$ cat /sys/devices/system/cpu/cpu2/topology/thread_siblings_list 2,6
$ cat /sys/devices/system/cpu/cpu3/topology/thread_siblings_list 3,7
# Disabling SMT on core 0
$ echo 0 | sudo tee /sys/devices/system/cpu/cpu4/online 0
$ lscpu
CPU(s): 8
On-line CPU(s) list: 0-3,5-7
Off-line CPU(s) list: 4
...
$ cat /sys/devices/system/cpu/cpu0/topology/thread_siblings_list
0
6. 系统时钟和CPU时钟
在计时上我们可以选择两类时钟:一个是系统提供的高精度时钟,比如Linux下面的clock_gettime system call,以及C++提供的标准库std::chrono. 另外一个则是CPU提供的time stamp counter(TSC)时间戳计数器。两个始终都是单调递增的。TSC相比系统的高精度时钟开销更小,大约需要20+ CPU cycles,高精度始终需要的cycles大约是它的10倍多, 所以TSC比较适合测量那些本身耗时就比较短的代码片段。
TSC有个重要特性就是,它是独立于CPU frequency的,也就是说即便是在CPU超频的情况下面,得到的也是normalized之后的结果。[注:这个数字,就是在超频一节,提到的reference cycles]
下面是我自己写的例程,在MacOS上可以编译运行。我不知道这样解释tsc diff是否正确,输出结果上存在20%的差距。
clokc diff = 88405377(HZ=2000000000, T=44.203 ms), sys ns = 35.443 ms
#include <cstdio>
#include <cassert>
#include <chrono>
#include <sys/types.h>
#include <sys/sysctl.h>

uint64_t get_cpu_freq(void)
{
    uint64_t freq = 0;
    size_t size = sizeof(freq);

    if (sysctlbyname("hw.cpufrequency", &freq, &size, NULL, 0) < 0)
    {
        perror("sysctl");
    }
    return freq;
}

void Test(int x) {
    int a = __builtin_ctz(x);
    int b = __builtin_ffs(x) - 1;
    int c = __builtin_popcount(x ^ (x -1)) - 1;
    // printf("%d %d %d %d\n", a, b, c, x);
    assert(a == b);
    assert(b == c);
}

uint64_t inline time_sys_ns() {
    return std::chrono::duration_cast<std::chrono::nanoseconds>
        (std::chrono::steady_clock::now().time_since_epoch()).count();
}
uint64_t inline time_cpu_tsc() {
    return __rdtsc();
}


int main() {
    uint64_t sa = time_sys_ns();
    uint64_t ca = time_cpu_tsc();
    for(int i=1;i<10000000;i++) {
        Test(i);
    }
    uint64_t sb = time_sys_ns();
    uint64_t cb = time_cpu_tsc();
    uint64_t freq = get_cpu_freq();
    printf("clokc diff = %lld(HZ=%lld, T=%.3f ms), sys ns = %.3f ms\n", cb - ca, freq, (cb - ca) * 1000.0f / freq, (sb - sa) * 1e-6);
    return 0;
}
7. 物理内存和Cache
最近几代常用内存的性能如下表,其中MT/s(million transfer per sec).
| DDR Generaition | Highest Data Rate(MT/s) | Typycal Read Latency(ns) |
|---|---|---|
| DDR3 | 2133 | 10.3 |
| DDR4 | 3200 | 12.5 |
| DDR5 | 6400 | 14 |
还有某些内存带宽更高的DRAM技术比如GDDR(Graphics DDR)和HBM(High Bandwidth Memory), 但是它们和DDR是不兼容的。
可以看到传输速率在提升,但是延迟基本没有什么变化。现代CPU通常支持多个独立的memory channels, 而一个memory channel的宽度是32bit or 64bit. 如果以64bit计算,主板上有4个memory channels的话,那么DDR4最高传输速率是在3.2G * 4 * 8 = 102.4GB/s. (也不知道这样计算的对不对)
我看了一下我的macbook air, DDR3-1600(1600MT/s), 我不知道memory channel的情况,假设只有一个64bit channel, 那么peak bandwidth应该就是12.8GB/s. 写了个小程序来做测试,只能做到一半 `bandwidth ` 6.653GB/s= ,不知道是否可以认为channel应该是32bit而不是64bit.
int main() {
    const int N = 32 * 1024 * 1024;
    char* src = new char[N];
    char* dst = new char[N];
    std::memset(src, 0x7f, N);
    const int T = 300;
    uint64_t start = time_sys_ns();
    for(int i=0;i<T;i++) {
        std::memcpy(dst, src, N);
    }
    uint64_t end = time_sys_ns();
    uint64_t dur = end - start;
    uint64_t size = (uint64_t)N * T;
    // to avoid optimization loop
    printf("dst[0] = %d\n", dst[0]);
    printf("dur = %lld ns, size = %lld, bandwidth = %.3fGB/s", dur, size , size * 1.0f/ dur);
    return 0;
}
下图是各级cache的延迟对比,习惯上把Main上面一个cache叫做LLC(last level cache).
| Cache | latency |
|---|---|
| L1 | 4cycles(1ns) |
| L2 | 10-25cycles(5-10ns) |
| L3 | ~40cycles(20ns) |
| Main | 200+cycles(100ns) |
如果按照TMA进行分类的话,在L1I造成的cache miss会被归类为front-end stall(因为获取指令造成的停顿),而data miss则会被归类为back-end stall(因为执行和取内存造成的停顿)。
使用 `perf` 工具我们可以查看到各个level造成的cache miss, 还可以查看mispredicted branch.
// L1 miss and hit
$ perf stat -e mem_load_retired.fb_hit,mem_load_retired.l1_miss, mem_load_retired.l1_hit,mem_inst_retired.all_loads -- a.exe
29580 mem_load_retired.fb_hit
19036 mem_load_retired.l1_miss
497204 mem_load_retired.l1_hit
546230 mem_inst_retired.all_loads

// L2 miss and hit
$ perf stat -e mem_load_retired.l1_miss, mem_load_retired.l2_hit,mem_load_retired.l2_miss -- a.exe
19521 mem_load_retired.l1_miss
12360 mem_load_retired.l2_hit
7188 mem_load_retired.l2_miss

// mispredicted branch.
$ perf stat -e branches,branch-misses -- a.exe
358209 branches
14026 branch-misses # 3,92% of all branches
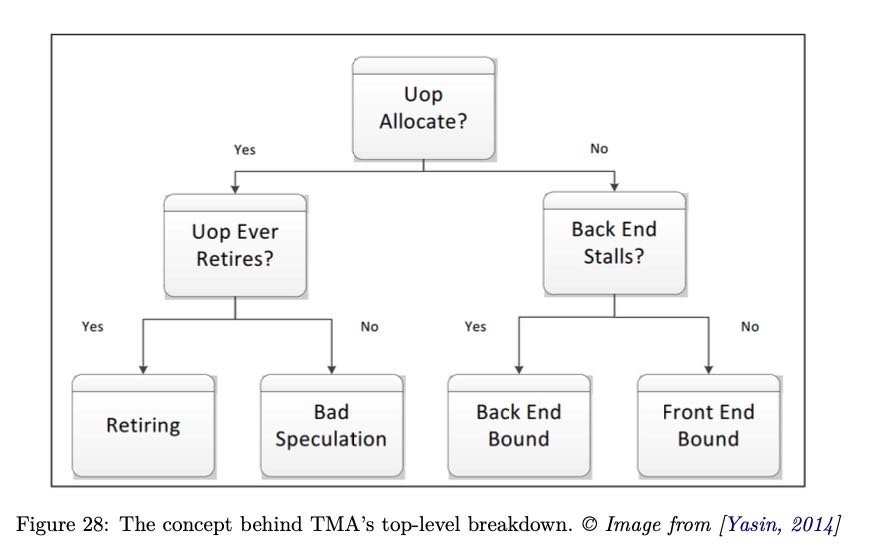
8. Top-Down Microarchitecture Analysis(TMA)
TMA(top-down microarchitecture analysis) 自顶向下-微架构-分析方法,是中系统化分析性能瓶颈的方法。
大致流程是:首先确定uop是否已经分配?如果没有分配的话,说明pipeline出现了stall. pipeline stall可能出现在取指和解码阶段(front-end),或者是执行和内存操作阶段(back-end)。 如果uop分配了的话,那么说说明pipeline是没有被stall的,那么可以看看retired instruction。如果retired比较差的话,那么就说明分支预测出现问题,否则就需要选择更加高效的指令。
确定了是哪个阶段出现问题,就可以尝试在下图中寻找具体的解决办法。
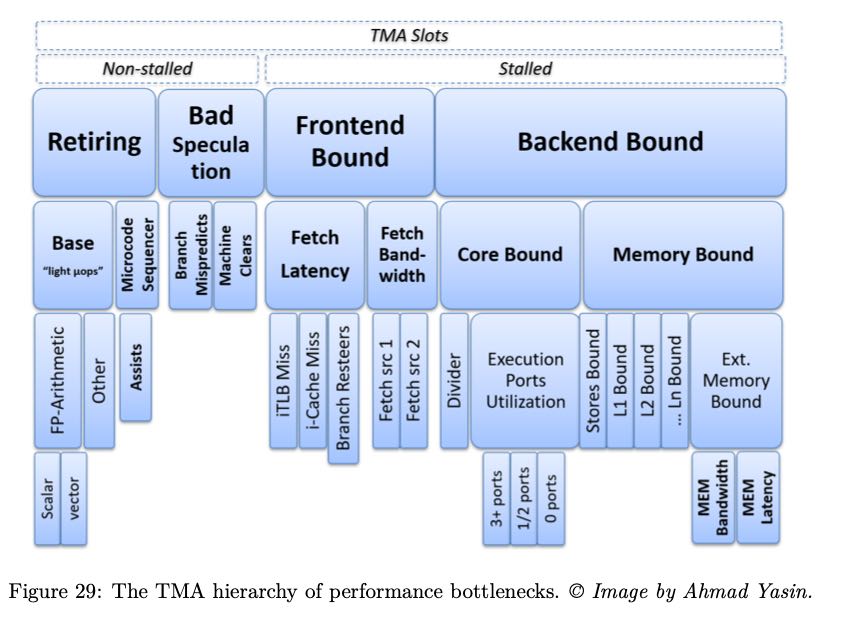
branch misprediction大约需要耗费15-20个cycles. 作者的个人经验是,"bad speculation"的比例大约在5-10%,只有高于10%的时候才需要关心这块。
9. CPU Front-End Optimization
关于cpu front-end optimization, 主要就是优化指令数据的布局,提高cache利用率。包括:
- basic block placement. 分支代码常用的分支部分放在一起
- basic block alignment. 这个后面说说
- function splitting. 将hot/cold code分开
- function grouping. 将多个小函数进行内联(compiler), 将hot code放在一起(linker)
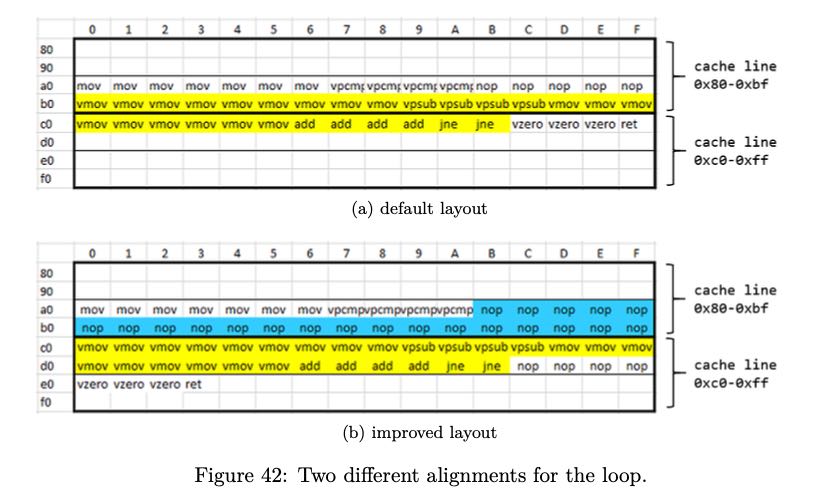
关于basic block alignment,尤其是loop alignment. 以下面这段代码为例
00000000004046a0 <_Z14benchmark_funcPi>: 4046a0: mov rax,0xffffffffffffff80 4046a7: vpcmpeqd ymm0,ymm0,ymm0
4046ab: nop DWORD PTR [rax+rax*1+0x0]
4046b0: vmovdqu ymm1,YMMWORD PTR [rdi+rax*1+0x80] # loop begins
4046b9: vpsubd ymm1,ymm1,ymm0
4046bd: vmovdqu YMMWORD PTR [rdi+rax*1+0x80],ymm1
4046c6: add rax,0x20
4046ca: jne 4046b0 # loop ends
4046cc:  vzeroupper
4046cf:  ret
循环开始地址是 0x4046b0, 这个地址没有和 64Bytes 对齐,而64bytes通常是cache line size. 也就是指令的cache locality做的不是特别好。 解决办法就是使用nop做padding,虽然nop指令不会使用任何资源,但是却会耗费IF,ID这两部。
关于function grouping示意图下图,办法就是根据过去的运行信息,在link阶段改进代码布局
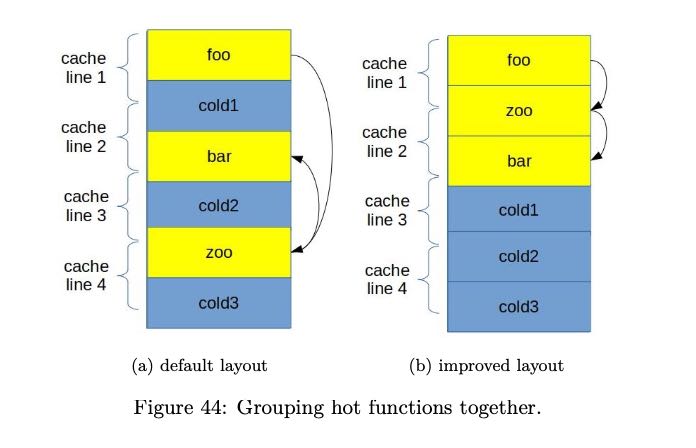
根据过去的运行信息进行优化也称为PGO(profile guided optimization)
It is not uncommon to see real workloads performance increase by up to 15% from using Profile Guided Optimizations. PGO does not only improve inlining and code placement but also improves register allocation and more.
In the mid-2018, Facebook open-sourced its binary relinker tool called BOLT. BOLT works on the already compiled binary. It first disassembles the code, then it uses profile information to do various layout transformations (including basic blocks reordering, function splitting, and grouping) and generates optimized binary [Panchenko et al., 2018]. A similar tool was developed at Google called Propeller, which serves a similar purpose as BOLT but claim certain advantages over it. It is possible to integrate optimizing relinker into the build system and enjoy an extra 5-10% performance speedup from the optimized code layout. The only thing one needs to worry about is to have a representative and meaningful workload for collecting profiling information.