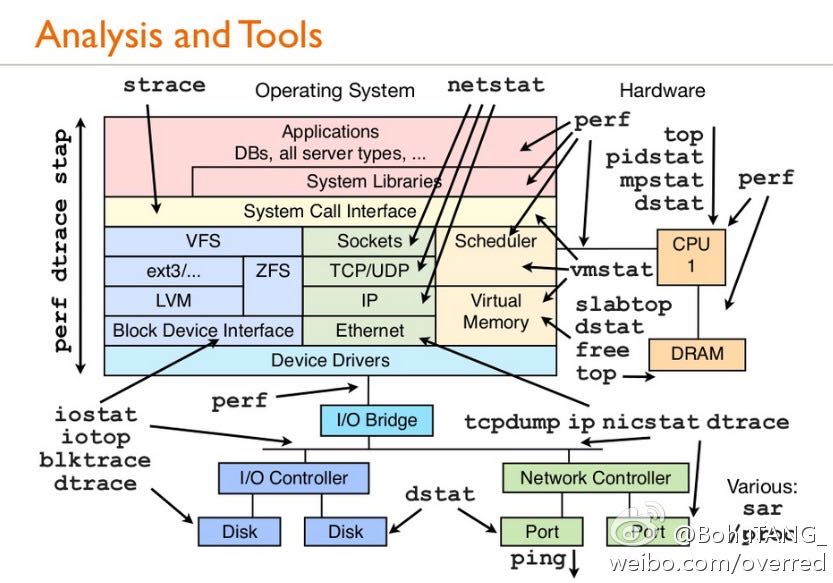
linux-tools
Table of Contents
1. Overview
2. CPU
2.1. mpstat
[zhangyan@tc-cm-et18.tc.baidu.com]$ mpstat -P ALL 1
Linux 2.6.9_5-10-0-1 (tc-cm-et18.tc.baidu.com)  2011年09月20日

08时39分58秒  CPU   %user   %nice %system %iowait    %irq   %soft   %idle    intr/s
08时39分59秒  all   37.55    0.00    0.00    0.00    0.00    0.00   62.45   1009.00
08时39分59秒    0    0.00    0.00    0.00    0.00    0.00    0.00  100.00   1002.00
08时39分59秒    1  100.00    0.00    0.00    0.00    0.00    0.00    0.00      0.00
08时39分59秒    2    0.00    0.00    0.00    0.00    0.00    0.00  100.00      7.00
08时39分59秒    3  100.00    0.00    0.00    0.00    0.00    0.00    0.00      0.00
08时39分59秒    4  100.00    0.00    0.00    0.00    0.00    0.00    0.00      0.00
08时39分59秒    5    0.00    0.00    0.00    0.00    0.00    0.00  100.00      0.00
08时39分59秒    6    0.00    0.00    0.00    0.00    0.00    0.00   99.00      0.00
08时39分59秒    7    0.00    0.00    0.00    0.00    0.00    0.00  100.00      0.00
- CPU 处理器编号
- %user 处理user状态占用率
- %nice 处理user状态并且是nice priority占用率
- %system 处理system状态占用率(不包括硬中断和软中断)
- %iowait 在进行io操作时候有cpu idle时间比率
- %irq CPU耗费在硬中断上时间比率
- %soft CPU耗费在软中断上时间比率(软中断可以被任何一个CPU处理)
- %idle 在没有io操作时候的cpu idle时间比率
- intr/s 每秒CPU中断次数(包括硬中断和软终端)
2.2. taskset
设置和获取进程的CPU亲和性. 对应的系统调用是sched_set(get)affinity/sched_getaffinity
- taskset -c 1,2,3 cmd # 程序只能运行在CPU #1,#2,#3上
- taskset -cp 1,2,3 pid # 进程只能运行在CPU #1,#2,#3上
- taskset -c mask cmd|pid # 通过mask格式进行设置,比如0x3就是#0和#1亲和性
- taskset -p <pid> # 进程<pid>亲和性
2.3. ps(process snapshot)
- ps -ef f # 进程树结构
- ps -eo user,sz,rss,minflt,majflt,pcpu,args # 指定字段
进程状态有下面几种:
- D uninterruptible sleep (usually IO)
- R running or runnable (on run queue)
- S interruptible sleep (waiting for an event to complete)
- T stopped, either by a job control signal or because it is being traced.
- W paging (not valid since the 2.6.xx kernel)
- X dead (should never be seen)
- Z defunct ("zombie") process, terminated but not reaped by its parent.
- < high-priority (not nice to other users)
- N low-priority (nice to other users)
- L has pages locked into memory (for real-time and custom IO)
- s is a session leader
- l is multi-threaded (using CLONE_THREAD, like NPTL pthreads do)
- + is in the foreground process group.
3. VM
3.1. vmstat
- vmstat 1 # 虚拟内存使用情况
- vmstat -s # 虚拟内存相关的系统事件次数统计
[dirlt@localhost.localdomain]$ vmstat 1
procs -----------memory---------- ---swap-- -----io---- --system-- -----cpu------
 r  b   swpd   free   buff  cache   si   so    bi    bo   in   cs us sy id wa st
 0  0      4  45752  33460  99324    0    0     1     1    1    9  0  0 99  0  0
 0  0      4  45752  33460  99324    0    0     0     0    1    8  0  0 100  0  0
- r 多少个进程正在等待运行
- b 多少个进程block住了
- swpd 虚拟内存(swap)
- free 空闲内存(phy)
- buff 缓冲内存(用于read/write等操作)(phy)
- cache 缓冲内存(用于文件系统以及内存系统管理)(phy)
- 前面三个参数相加才是可用内存大小
- si 读取disk使用的虚拟内存
- so 写disk使用的虚拟内存
- bi[block in] 块设备读取速率,blocks/s
- bo[block out] 块设备写速度,blocks/s
- in[interrupt] 每秒中断个数
- cs[context switch] 每秒上下文切换次数
- us 用户态时间[user]
- sy 系统时间[system]
- id 空闲时间[idle]
- wa 等待io时间[wait IO]
- st 虚拟机使用时间[stolen from VM]
[zhangyan04@tc-hpc-dev.tc.baidu.com]$ vmstat -s
      8191996  total memory
      4519256  used memory
      1760044  active memory
      2327204  inactive memory
      3672740  free memory
        76200  buffer memory
      3935788  swap cache
      1020088  total swap
            0  used swap
      1020088  free swap
       423476 non-nice user cpu ticks
           91 nice user cpu ticks
       295803 system cpu ticks
     70621941 idle cpu ticks
        39354 IO-wait cpu ticks
          800 IRQ cpu ticks
        52009 softirq cpu ticks
       317179 pages paged in
     54413375 pages paged out
            0 pages swapped in
            0 pages swapped out
    754373489 interrupts
    500998741 CPU context switches
   1323083318 boot time
       418742 forks
3.2. free
[zhangyan04@tc-hpc-dev.tc.baidu.com]$ free -t
             total       used       free     shared    buffers     cached
Mem:       8191996    4519868    3672128          0      76204    3935864
-/+ buffers/cache:     507800    7684196
Swap:      1020088          0    1020088
Total:     9212084    4519868    4692216
- total 总内存大小[实际内存大小]
- used 已经使用大小[buffers+shared+cached+应用程序使用]
- free 未使用大小
- shared 共享内存大小
- buffers 用于read/write等操作
- cached 用于文件系统以及内存系统
- - buffers/cache 表示used-buffers/cached的大小,就是应用程序已经使用内存大小
- + buffers/cache 表示free+buffers/cached的大小,就是所有可供应用程序使用的大小
- Swap:total 交换分区大小
- Swap:used 交换分区使用大小
- Swap:free 可以使用的分区大小
关于buffers和cached区别, see Linux Kernel Development Chapter16 页高速缓存和页回写
3.3. vmtouch
https://github.com/hoytech/vmtouch 用来warmup数据
- mlock/munlock 将进程部分内存lock住而不会切换到swap分区上面
- mlockall/munlockall 将进程所有内存都lock住而不会切换到swap分区上面
- posix_fadvise 告诉系统对文件数据访问模式(有助于系统进行IO优化)
4. DiskIO
4.1. iostat
dirlt@dirlt-virtual-machine:~$ iostat -dx 1
Linux 3.2.0-23-generic (dirlt-virtual-machine)  2012年06月18日  _x86_64_        (1 CPU)

xsDevice:         rrqm/s   wrqm/s     r/s     w/s    rkB/s    wkB/s avgrq-sz avgqu-sz   await r_await w_await  svctm  %util
scd0              0.00     0.00    0.00    0.00     0.02     0.00     8.00     0.00   29.00   29.00    0.00  29.00   0.01
sda               6.34     5.72   15.95   12.60   192.62  5675.85   411.10     2.48   87.41   18.33  174.88   2.74   7.83

Device:         rrqm/s   wrqm/s     r/s     w/s    rkB/s    wkB/s avgrq-sz avgqu-sz   await r_await w_await  svctm  %util
scd0              0.00     0.00    0.00    0.00     0.00     0.00     0.00     0.00    0.00    0.00    0.00   0.00   0.00
sda               0.00     0.00    0.00    0.00     0.00     0.00     0.00     0.00    0.00    0.00    0.00   0.00   0.00
- Device 设备名
- tps number of transfers per second.对于IO device多个请求可能会合并成为一个transfer.不过似乎没有太大意义。
- Blk_read/s(kB_read/s, MB_read/s). 读速度,这里Block相当于一个扇区占据512bytes.
- Blk_wrtn/s(kB_wrtn/s, MB_wrtn/s). 写速度。
- Blk_read(kb_read, MB_read). 读总量
- Blk_wrtn(kB_wrtn, MB_wrtn). 写总量
- rrqm/s 每秒多少个读请求被merge.当系统调用需要读取数据的时候,VFS将请求发到各个FS,如果FS发现不同的读取请求读取的是相同Block的数据,FS会将这个请求合并Merge
- wrqm/s 每秒多少个些请求被merge
- r/s 每秒多少个读请求(after merged)
- w/s 每秒多少个写请求(after merged)
- rsec/s(rkB/s, rMB/s) 读速度。sec表示sector.
- wsec/s(wkB/s, wMB/s) 写速度
- avgrq-sz 提交到这个device queue上面请求的平均大小(in sectors)
- avgqu-sz 提交到这个device queue上面请求的平均长度
- await 提交到这个device上面请求处理的平均时间(ms)
- r_await 提交到这个device上面读请求处理的平均时间
- w_await 提交到这个device上面写请求处理的平均时间
- svctm #todo: not used any more
- %util CPU在处理IO请求时的百分比.可以认为是IO设备使用率.
4.2. iotop
`iotop -ao [-P]`
- o 只展现有IO活动的任务
- a 将iotop启动以来IO数值累加
- P 以process而非thread为单位
5. NetworkIO
5.1. ifconfig
- ifconfig <eth-x> <ip> # 创建网卡绑定IP
- ifconfig <eth-x> down # 关闭网卡
- ifconfig <eth-x> up # 开启网卡
- ifconfig <eth-x> # 网卡信息
`/sbin/ifconfig -a` 网卡配置和统计数据
[zhangyan04@tc-hpc-dev.tc.baidu.com]$ /sbin/ifconfig -a
eth0      Link encap:Ethernet  HWaddr 00:1D:09:22:C9:A9
          BROADCAST MULTICAST  MTU:1500  Metric:1
          RX packets:0 errors:0 dropped:0 overruns:0 frame:0
          TX packets:0 errors:0 dropped:0 overruns:0 carrier:0
          collisions:0 txqueuelen:1000
          RX bytes:0 (0.0 b)  TX bytes:0 (0.0 b)
          Interrupt:16 Memory:f4000000-f4012800

eth1      Link encap:Ethernet  HWaddr 00:1D:09:22:C9:A7
          inet addr:10.26.140.39  Bcast:10.26.140.255  Mask:255.255.255.0
          UP BROADCAST RUNNING MULTICAST  MTU:1500  Metric:1
          RX packets:90671796 errors:0 dropped:14456 overruns:0 frame:0
          TX packets:143541932 errors:0 dropped:0 overruns:0 carrier:0
          collisions:0 txqueuelen:1000
          RX bytes:71169282564 (66.2 GiB)  TX bytes:74096812979 (69.0 GiB)
          Interrupt:16 Memory:f8000000-f8012800

lo        Link encap:Local Loopback
          inet addr:127.0.0.1  Mask:255.0.0.0
          UP LOOPBACK RUNNING  MTU:16436  Metric:1
          RX packets:231762640 errors:0 dropped:0 overruns:0 frame:0
          TX packets:231762640 errors:0 dropped:0 overruns:0 carrier:0
          collisions:0 txqueuelen:0
          RX bytes:98089257363 (91.3 GiB)  TX bytes:98089257363 (91.3 GiB)
- encap # 网卡连接网络类型. Ethernet(以太网), Local Loopback(本地环路)
- HWaddr # 网卡物理地址(MAC)
- inet_addr # 绑定IP地址
- Bcast # IP的广播地址
- Mask # 子网掩码
- UP(打开) BROADCAST(广播) MULTICAST(多播) RUNNING(运行)
- MTU # (Maximum Transport Unit)最大传输单元,以太网1500字节
- Metric ?
- RX packets # 接受packets数目
- TX packets # 传输packets数目
- errors # 错误packets数目
- dropped # 丢弃packets数目
- overruns frame carrier ?
- collisions ?
- txqueuelen # 发送packets的queue长度上限
- RX bytes # 接收字节
- TX bytes # 发送字节
5.2. netstat
- netstat -s [–tcp|–udp|–raw] # 各种协议统计数据
- netstat -ntp # 本机所有TCP链接
- netstat -nltp # 本机所有处于监听状态的TCP连接
- netstat -i # 网卡流量统计信息
- netstat -r # 路由规则
5.3. ss(socket statistics)
`ss -s` 系统所有socket使用情况汇总
➜  notes git:(master) ✗ ss -s
Total: 1071 (kernel 0)
TCP:   63 (estab 23, closed 1, orphaned 0, synrecv 0, timewait 1/0), ports 0

Transport Total     IP        IPv6
*	  0         -         -
RAW	  1         1         0
UDP	  29        23        6
TCP	  62        56        6
INET	  92        80        12
FRAG	  0         0         0
5.4. tc(traffic control)
tc - show / manipulate traffic control settings.
netem (network emulation) http://www.linuxfoundation.org/collaborate/workgroups/networking/netem
- tc qdisc [add|change] dev [DEV] root netem [specification] # 在设备上创建和修改规则
- tc qdisc del dev [DEV] root # 删除设备上定义规则
- tc qdisc show dev [DEV] # 查看设备上定义的规则
specification
- delay 100ms 10ms 25%. 延迟分布在[100-10,100+10]. next_delay = random(90,110) * 0.75 + last_delay * 0.25
- delay 100ms 10ms distribution normal 延迟正态分布[100-10,100+10]
- loss 1% #丢包概率1%
- loss 1% 25% #丢包概率在random(1%) * 0.75 + last_loss * 0.25
- duplicate 1% #重复概率1%
- corrupt 1% #坏包概率1%
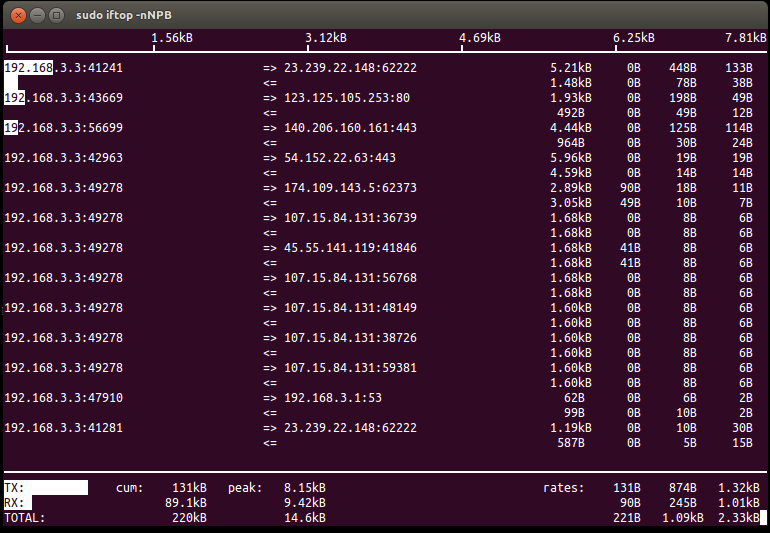
5.5. iftop
http://www.ex-parrot.com/~pdw/iftop/
`iftop -nNPB` see conf
- TX / RX # 传输接收
- cum # cumulativ 累积值
- peak # 最近40s的传输峰值
- rates # 最近2, 10, 40s的传输平均值
- 白色部分是传输速率可视化表示
5.6. iperf
https://iperf.fr/ 测量网络吞吐
5.7. mtr
my traceroute. ping和traceroute两个工具的合体. 两种工作方式, 一种是实时查看, 一种是生成报表. 两者区别是实时查看的话mtr会不断地发送ICMP, 而报表模式则需要指定发送多少个ICMP.
root@iZ62cqwtc33Z:~/podcast-crawler# sudo mtr d3s7zw2sg6cujw.cloudfront.net -r -w -c 10
Start: Wed Aug 10 16:39:08 2016
HOST: iZ62cqwtc33Z                                 Loss%   Snt   Last   Avg  Best  Wrst StDev
  1.|-- 11.246.154.118                                0.0%    10    0.7   0.8   0.7   1.0   0.0
  2.|-- 11.246.154.118                                0.0%    10    0.9   0.8   0.7   0.9   0.0
  3.|-- 116.251.66.166                                0.0%    10    1.0   0.9   0.8   1.0   0.0
  4.|-- 63-216-176-73.static.pccwglobal.net           0.0%    10    1.1   1.4   1.1   2.9   0.3
  5.|-- TenGE3-8.br01.tok02.pccwbtn.net               0.0%    10   52.6  72.8  52.5 218.5  52.4
  6.|-- TenGE3-8.br01.tok02.pccwbtn.net               0.0%    10   52.2  79.0  52.2 218.6  58.3
  7.|-- 63-218-251-54.static.pccwglobal.net           0.0%    10   52.2  52.3  52.1  53.1   0.0
  8.|-- 52.95.30.177                                  0.0%    10   62.0  66.7  61.3  71.3   3.8
  9.|-- 52.95.30.32                                   0.0%    10   60.1  60.5  59.9  61.1   0.0
 10.|-- 27.0.0.115                                    0.0%    10   61.7  62.0  61.3  66.5   1.5
 11.|-- ???                                          100.0    10    0.0   0.0   0.0   0.0   0.0
 12.|-- ???                                          100.0    10    0.0   0.0   0.0   0.0   0.0
 13.|-- ???                                          100.0    10    0.0   0.0   0.0   0.0   0.0
 14.|-- server-54-192-233-135.nrt12.r.cloudfront.net 10.0%    10   86.7  86.9  86.7  87.3   0.0
这里想测试一下从主机到cloudfront.net的速度如何. 一共发送了100个packets, 可以看到共有14跳. 最后一跳的丢包率大约在10%, ping的平均值在86.9ms.
6. System
6.1. strace
`strace -C -ttt -T -r [-p pid | args]`
- C # 运行结束打印汇总
- ttt # 打印syscall绝对时间戳
- r # 打印syscall相对时间戳
- T # syscall耗时
6.2. sysprof
http://sysprof.com/ a statistical, system-wide profiler for Linux.
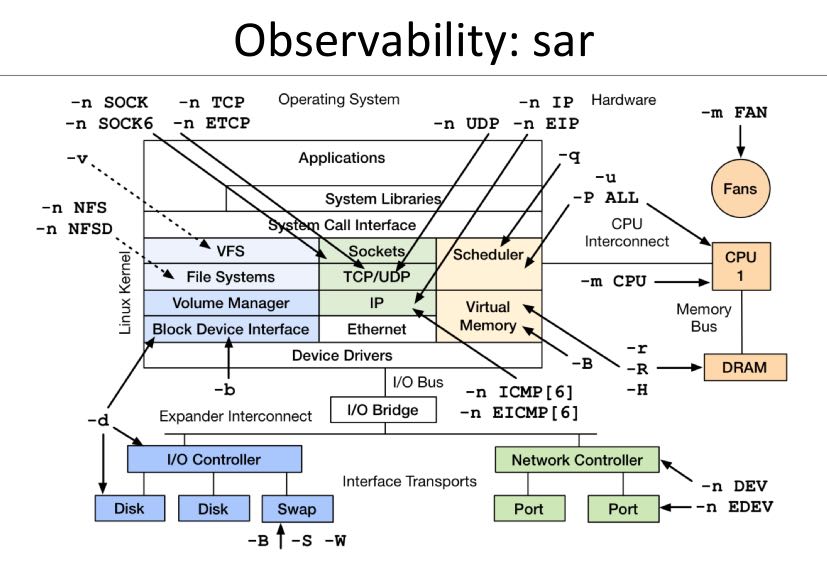
6.3. sar
`sar -n DEV 1` 网卡流量
- IFACE network interface
- rxpck/s rcv packets/s
- txpck/s snd packets/s
- rxbyt/s rcv bytes/s
- txbyt/s snd bytes/s
6.4. pidstat
`pidstat [-d | -r | -s | -u | -v | -w] [-p pid] 1`
- p # 观察特定进程, 否则只观察活跃进程
- d # 磁盘IO状况
- r # 内存使用
- s # 堆栈情况
- u # CPU使用
- v # 内核资源
- w # 上下文切换
6.5. dstat
6.6. collectl

7. Admin
7.1. rsync
- `rsync -avrz dir user@host:/dir/` # 注意目录后面需要加上/
- `rsync -avrz /dir/file1 user@host:/dir/file`
7.2. lsof
- lsof -nP | grep "delete" # 已被删除但是依然被某些进程打开的文件
- lsof /home # 哪些进程打开了/home文件(目录)
7.3. uptime
➜  notes git:(master) ✗ uptime
 13:50:11 up 3 days, 17:12,  4 users,  load average: 0.27, 0.29, 0.27
- The current time,
- how long the system has been running,
- how many users are currently logged on,
- and the system load aver‐ages for the past 1, 5, and 15 minutes.
7.4. crontab
`crontab -e` 编辑crontab配置文件
任务分为6个字段: minute hour day month week command
- minute范围是0-59
- hour范围是0-23
- day范围是1-31
- month范围是1-12
- week范围是0-7[0/7表示Sun]
对于每个字段可以有几种表示
- - 表示匹配所有时间
- num 表示完全匹配
- num1-num2 表示匹配范围
- num1,num2,num3… 进行枚举匹配
- num1-num2/interval 表示从num1-num2时间段内每interval间隔
配置文件参考
0 6 * * * /home/dirlt/platform/apache/bin/apachectl restart 每天早上6点重启apache
0,30 18-23 * * * /home/dirlt/platform/apache/bin/apachectl restart 每天18-23时候每隔半小时重启apache
\* 23-7/1 * * * /* 23-7/1 * * * /usr/local/apache/bin/apachectl restart 每天从23到次日7点每隔一小时重启apache
7.5. ntp
ntp(network time protocol)是用来做机器时间同步的,包含下面几个组件:
- ntpd(ntp daemon) 后台进程可以用来从其他机器上面同步时间,也可以为其他机器提供时间同步。配置文件是/etc/ntpd.conf.
- ntpq(ntp query) 查询当前时间同步的情况。
- ntpdate(ntp date) 和其他机器进行同步,不可以和ntpd共同使用。
[dirlt@umeng-ubuntu-pc] > sudo /etc/init.d/ntp start
 * Starting NTP server ntpd
   ...done.
[dirlt@umeng-ubuntu-pc] > sudo /usr/sbin/ntpdate cn.pool.ntp.org
12 Nov 17:08:07 ntpdate[30044]: the NTP socket is in use, exiting
[dirlt@umeng-ubuntu-pc] > sudo /etc/init.d/ntp stop
 * Stopping NTP server ntpd
   ...done.
[dirlt@umeng-ubuntu-pc] > sudo /usr/sbin/ntpdate cn.pool.ntp.org
12 Nov 17:08:22 ntpdate[30061]: adjust time server 202.112.31.197 offset -0.071953 sec
[dirlt@umeng-ubuntu-pc] > ntpq -p
     remote           refid      st t when poll reach   delay   offset  jitter
==============================================================================
 netmon2.dcs1.bi 121.182.147.191  2 u    7   64    1  405.743   10.731   0.000
 202-150-213-154 133.243.238.163  2 u    8   64    1  171.722  -131.73   0.000
 dns1.synet.edu. 223.255.185.2    2 u    7   64    1  166.558  -39.375   0.000
 Hshh.org        66.220.9.122     2 u    6   64    1   41.734  -109.29   0.000
 europium.canoni 193.79.237.14    2 u    4   64    1  673.181  -240.24   0.000
一个重要的问题是,daemon以什么时间间隔来和指定的server进行同步以及如何调整差异. (How does it work?) ntp是可以在minpoll和maxpoll指定的时间间隔内来选择同步间隔的,默认使用minpoll也就是64seconds.
7.6. iptables
`iptables -S` 列举所有规则
➜  ~GALERA_SRC git:(yan) sudo iptables -S
-P INPUT ACCEPT
-P FORWARD ACCEPT
-P OUTPUT ACCEPT
- INPUT ACCEPT 所有输入都接受
- FORWARD ACCEPT 所有转发接受
- OUTPUT ACCEPT 所有输出接受
`/sbin/iptables -I INPUT -p tcp –dport 80 -j ACCEPT` 打开80端口
`iptables -A [chain] [chain-specification]` 添加规则
sudo iptables -A INPUT -s "192.168.100.104" -d "192.168.100.105" -j DROP
其中chain指INPUT, 之后部分都是chain-specification. 其中s表示过滤源地址,d表示目的地址,而-j而表示动作。(在输入上, 如果src/dst和上面匹配的话, 数据包被丢弃)
`iptables -D` 删除规则。规则既可以使用rule-num来引用,也可以使用chain-specification来指定
➜  ~GALERA_SRC git:(yan) sudo iptables -S
-P INPUT ACCEPT
-P FORWARD ACCEPT
-P OUTPUT ACCEPT
-A INPUT -s 192.168.100.104/32 -d 192.168.100.105/32 -j DROP
-A INPUT -s 192.168.100.105/32 -d 192.168.100.104/32 -j DROP
➜  ~GALERA_SRC git:(yan) sudo iptables -D INPUT 1
➜  ~GALERA_SRC git:(yan) sudo iptables -D INPUT -s 192.168.100.105/32 -d 192.168.100.104/32 -j DROP
➜  ~GALERA_SRC git:(yan) sudo iptables -S
-P INPUT ACCEPT
-P FORWARD ACCEPT
-P OUTPUT ACCEPT
7.7. ab
ab(apache benchmarking)
`ab -c 100 -n 10000 -r localhost/` 共10k个请求, 并发数100. 结果 `Requsts per second` 显示QPS在13k/s
Server Software:        nginx/1.2.1
Server Hostname:        localhost
Server Port:            80

Document Path:          /
Document Length:        1439 bytes

Concurrency Level:      100
Time taken for tests:   0.760 seconds
Complete requests:      10000
Failed requests:        0
Write errors:           0
Total transferred:      16500000 bytes
HTML transferred:       14390000 bytes
Requests per second:    13150.09 [#/sec] (mean)
Time per request:       7.605 [ms] (mean)
Time per request:       0.076 [ms] (mean, across all concurrent requests)
Transfer rate:          21189.11 [Kbytes/sec] received

Connection Times (ms)
              min  mean[+/-sd] median   max
Connect:        0    0   1.4      0      18
Processing:     2    7   1.8      7      20
Waiting:        1    7   1.8      7      20
Total:          5    7   2.0      7      20

Percentage of the requests served within a certain time (ms)
  50%      7
  66%      7
  75%      8
  80%      8
  90%      9
  95%     10
  98%     14
  99%     19
 100%     20 (longest request)