How NOT to Measure Latency
https://www.infoq.com/presentations/latency-response-time/ https://bravenewgeek.com/everything-you-know-about-latency-is-wrong/ http://hdrhistogram.org/
如何正确地测量和解读延迟。里面有这么几个重点:
- 我们关注的不是单个延迟,而是延迟的分布。
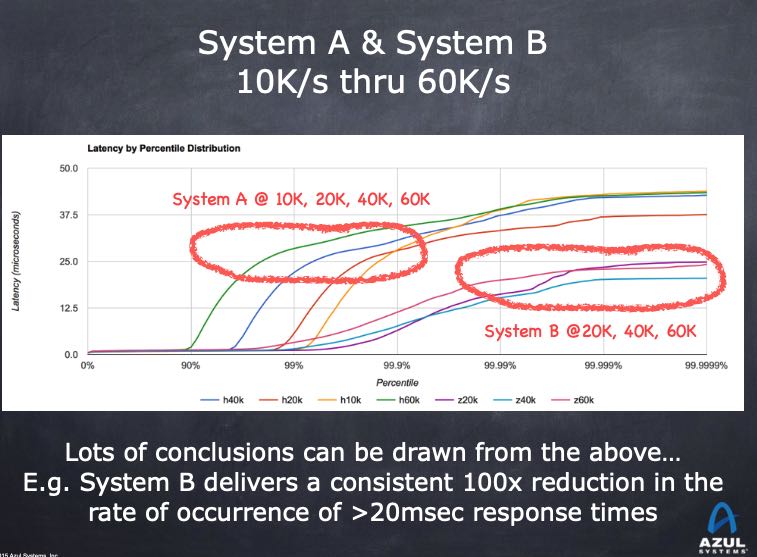
- 95%, 99% pth反应不了真实情况,大部分用户会经历超过99%的延迟,取平均就更没有什么意义了。
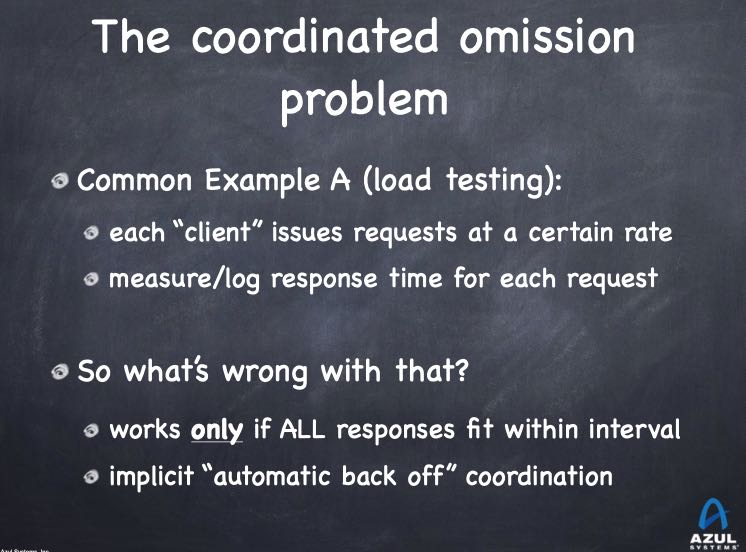
- CO(coordinated omission) 协调一致的忽略,这个词不太好翻译。我们测量工具和方法,本身就让我们看到更好看的数据,而不是系统真实表现。
- 测量延迟的关键就在于,区分service time/response time. service time是你看到的系统服务时间,而response time是用户真实感受到的时间。
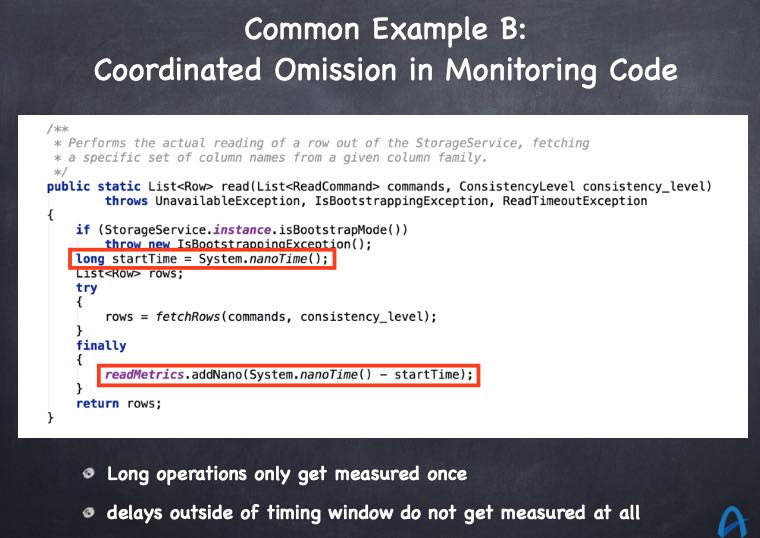
因为CO的原因,会让你的service time看起来非常非常的好,但是实际的response time是非常非常的差。作者给出了几个CO的例子,这些例子我们现实中经常遇到:第一个就是压力测试工具一旦发现系统不响应就会backoff, 其实这个时候系统本身已经出问题了,但是这段时间的延迟数据被忽略。最后系统表现好的时候我们测量次数多,而表现不好的时候测量次数少。第二个就是我们在代码里面增加timer.start()/stop(), 然后选择99%pth,而系统比如因为GC出现的pause时间就是1%,那么最后看到的数据都是没有GC pause时期的数据。
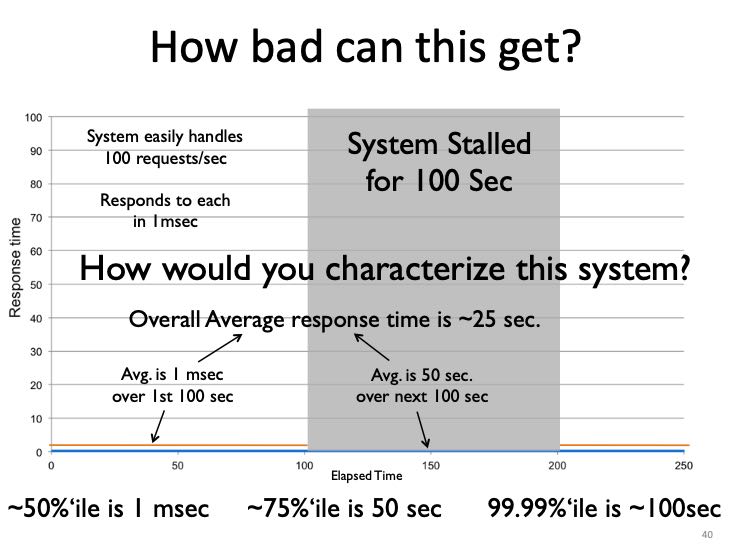
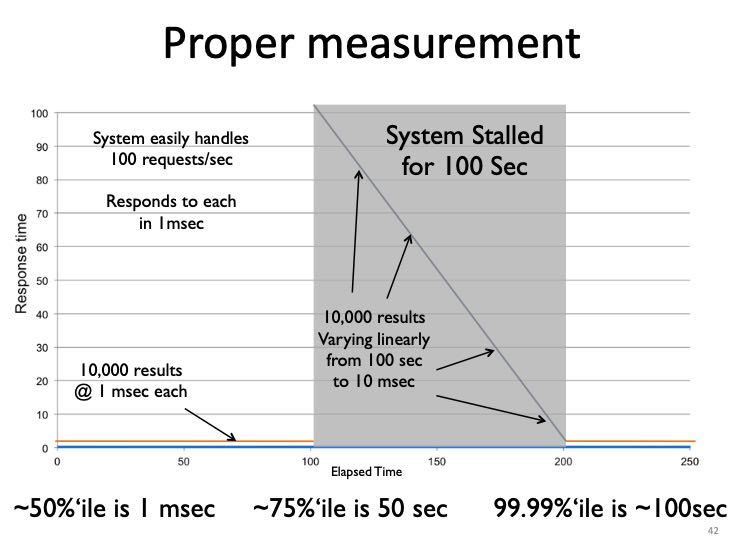
我们对下面一个测量延迟场景做分析。下面是正确的测试方法:
- The average over the first 100 seconds is 1 ms.
- The average over the next 100 seconds is 50 seconds.
- The average over the 200 seconds is 25 seconds.
- The 50th percentile is 1 ms.
- The 75th percentile is 50 seconds.
- The 99.99th percentile is 100 seconds.
但是如果我们在stalled期间只做了1次测量会怎么样呢(测试工具因为迟迟不返回所以挂住了):
- The average over the 200 seconds is 10.9 ms (should be 25 seconds).
- The 50th percentile is 1 ms.
- The 75th percentile is 1 ms (should be 50 seconds).
- The 99.99th percentile is 1 ms (should be 100 seconds).
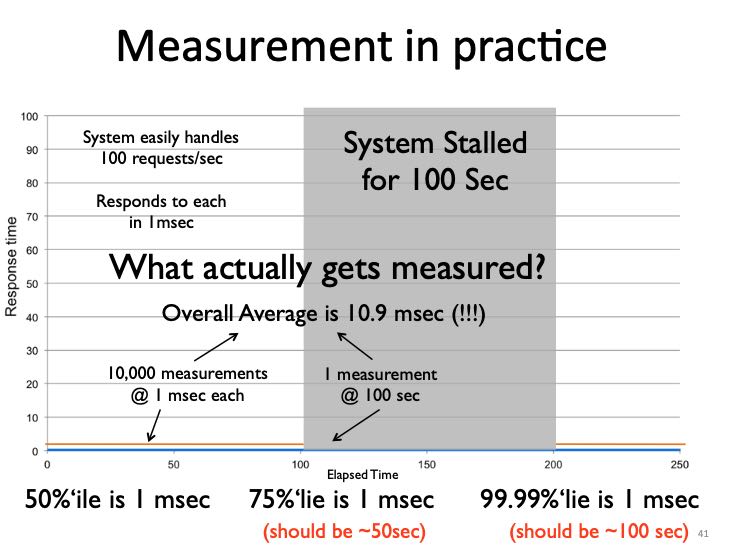
正确的测试方式应该如下,就是在stalled期间我们依然需要发起请求,如果我们期间不做任何请求话,那么就是CO
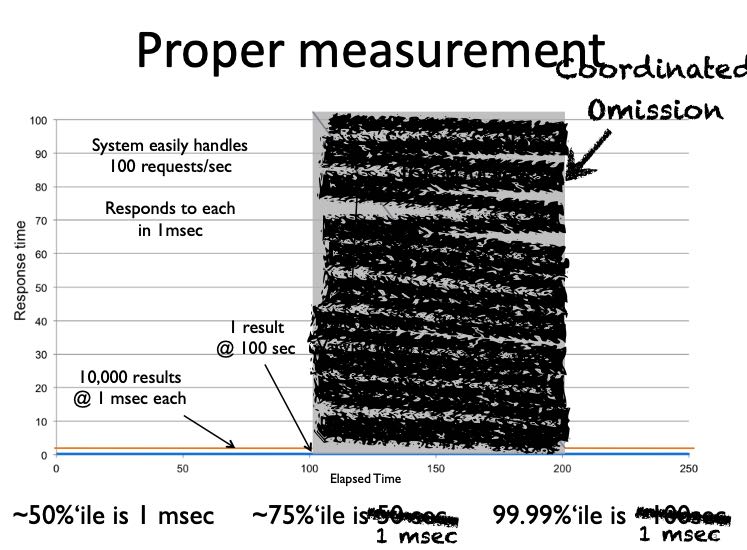
使用CO得到的错误延迟,不仅仅会让我们对系统有错误的理解,还会让我们认为某些改进是不好的。如果我们将stalled期间的延迟下降到了5ms,得到的数据反而比stalled的要更差。
- The 50th percentile is 1 ms
- The 75th percentile is 2.5 ms (stall showed 1 ms)
- The 99.99th percentile is 5 ms (stall showed 1 ms)
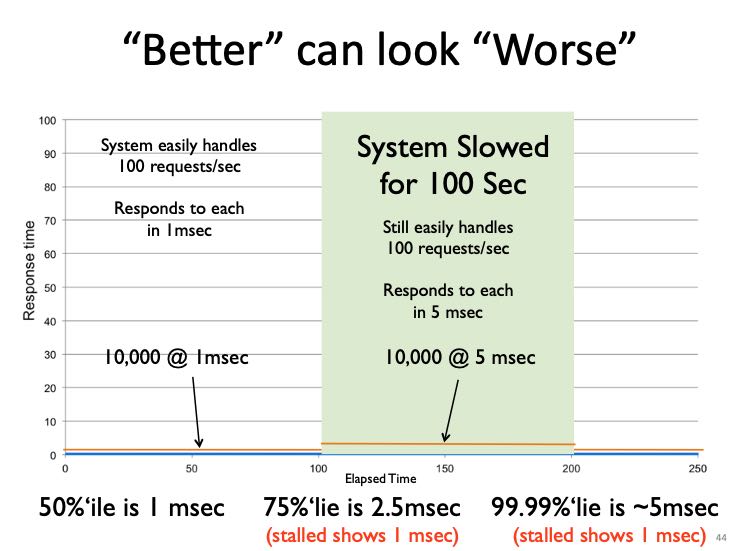
一切问题都是错误的测量方法导致的。
得到latency数值之后应该如何使用它呢?首先我们不能只使用99%, 至少也要99.99%或者干脆是max. 然后如果这个latency太高的话,通常意味着系统负载是过来的,没有办法处理过来,所以我们应该在系统指定的吞吐下进行压测。测量结果至少应该如下图:两个系统在不同的throughput下面,各自的99.9%, 99.99% latency有多少。如果我们选择99.99% latency作为参考,那么看这个latency是否可以接受。如果不能接受,那么就需要继续降低吞吐,知道符合latency条件为止。此时我们才能知道系统的正常负载是多少,然后在这个复杂下面比较各个系统的延迟,然后再进行容量规划。
