Google-Wide Profiling: A Continuous Profiling Infrastructure for Data Centers
Table of Contents
http://research.google.com/pubs/pub36575.html @ 2010
1. Introduction
- As cloud-based computing grows in pervasiveness and scale, understanding datacenter applications’ performance and utilization characteristics is critically important, because even minor performance improvements translate into huge cost savings.
- Traditional performance analysis, which typically needs to isolate benchmarks, can be too complicated or even impossible with modern datacenter applications.(传统性能分析通常是使用benchmark,但是对于现代的分布式系统来说过于复杂)
- It’s easier and more representative to monitor datacenter applications running on live traffic. However, application owners won’t tolerate latency degradations of more than a few percent, so these tools must be nonintrusive and have minimal overhead.
- As with all profiling tools, observer distortion must be minimized to enable meaningful analysis. OProfile, a DCPI-inspired tool, collects and reports data much in the same way for a plethora of architectures, though it offers less sophisticated analysis. GWP uses OProfile (http://oprofile.sourceforge.net) as a profile source.(GWP底层使用oprofile来作为profiling source)
- Sampling-based tools can bring overhead and distortion to acceptable levels, so they’re uniquely qualified for performance monitoring in the data center. (基于采样的方法可以将额外开销以及失真降低到最小程度)
- Google-Wide Profiling can be theoretically viewed as an extension of the Digital Continuous Profiling Infrastructure (DCPI) to data centers.
- GWP is a continuous profiling infrastructure;
- it samples across machines in multiple data centers and collects various events(在多机房多机器上面收集各种事件)
- such as stack traces, hardware events, lock contention profiles, heap profiles, and kernel events(事件信息包括stack trace, 硬件事件,锁冲突,堆使用以及内核事件等)
- allowing cross-correlation with job scheduling data, application-specific data, and other information from the data centers(并且能够将集群内所有机器上的信息进行交叉关联)
- GWP collects daily profiles from several thousand applications running on thousands of servers, and the compressed profile database grows by several Gbytes every day.(从上千台机器收集数据,每天产生GB级别的数据)
- Profiling at this scale presents significant challenges that don’t exist for a single machine.(集群profileing存在很多挑战)
- Verifying that the profiles are correct is important and challenging because the workloads are dynamic.(profiles正确性)
- Managing profiling overhead becomes far more important as well, as any unnecessary profiling overhead can cost millions of dollars in additional resources(管理profiling额外开销)
- Finally, making the profile data universally accessible is an additional challenge.(将profile数据聚合并且提供统一访问接口)
- GWP is also a cloud application, with its own scalability and performance issues.
- GWP is a continuous profiling infrastructure;
- With this volume of data, we can answer typical performance questions about datacenter applications, including the following:(能够了解下面这些信息)
- What are the hottest processes, routines, or code regions?
- How does performance differ across software versions?
- Which locks are most contended?
- Which processes are memory hogs?
- Does a particular memory allocation scheme benefit a particular class of applications?
- What is the cycles per instruction (CPI) for applications across platforms?
- Additionally, we can derive higher-level data to more complex but interesting questions, such as which compilers were used for applications in the fleet, whether there are more 32-bit or 64-bit applications running, and how much utilization is being lost by suboptimal job scheduling
2. Infrastructure
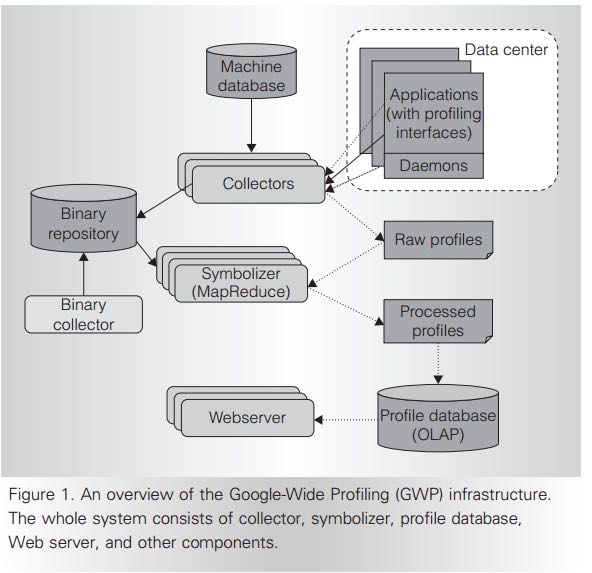
2.1. Collector
- GWP samples in two dimensions. At any moment, profiling occurs only on a small subset of all machines in the fleet, and event-based sampling is used at the machine level.(采样是在两个维度上进行的,首先每次只是在一部分机器上进行采样,其次在每台机器上针对事件进行采样)。
- Sampling in only one dimension would be unsatisfactory; if event-based profiling were active on every machine all the time, at a normal event-sampling rate, we would be using too many resources across the fleet. Alternatively, if the event-sampling rate is too low, profiles become too sparse to drill down to the individual machine level.(仅仅在一个维度上做采样是不行的)
- For each event type, we choose a sampling rate high enough to provide meaningful machine-level data while still minimizing the distortion caused by the profiling on critical applications.(对于每种事件类型使用不同的采样率)
- A central machine database manages all machines in the fleet and lists every machine’s name and basic hardware characteristics. The GWP profile collector periodically gets a list of all machines from that database and selects a random sample of machines from that pool. The collector then remotely activates profiling on the selected machines and retrieves the results.(中心化的机器列表数据库,里面包含了所有的机器以及对应的机器特性。collector定期选择从中选择一部分机器,激活上面的profiling进程,然后收集结果)
- It retrieves different types of sampled profiles sequentially or concurrently, depending on the machine and event type. For example, the collector might gather hardware performance counters for several seconds each, then move on to profiling for lock contention or memory allocation. It takes a few minutes to gather profiles for a specific machine.(采样是顺序还是并行完成的,取决于机器以及事件类型。通常对于每台机器会采样数分钟来收集所有的profiles)
- For robustness, the GWP collector is a distributed service. It helps improve availability and reduce additional variation from the collector itself. To minimize distortion on the machines and the services running on them, the collector monitors error conditions and ceases profiling if the failure rate reaches a predefined threshold. Aside from the collector, we monitor all other GWP components to ensure an always-on service to users.(分布式服务。为了减少profile结果失真,collector会检测机器上是否出现故障。如果故障比例超过一定的阈值那么就会停止profiling)
- On the top of the two-dimensional sam- pling approach, we apply several techniques to further reduce the overhead. (在上层还做了一些其他采样方式来减少overhead)
- First, we mea- sure the event-based profiling overhead on a set of benchmark applications and then con- servatively set the maximum rates to ensure the overhead is always less than a few percent.(使用benchmark来测试event-based profiling的overhead开销有多大,然后觉得最大的采样速率)
- Second, we don’t collect whole call stacks for the machine-wide profiles to avoid the high overhead associated with unwinding (but we collect call stacks for most server profiles at lower sampling frequencies).(call stack信息在高负载的时候不会收集全部)
- Finally, we save the profile and metadata in their raw for- mat and perform symbolization on a separate set of machines. (采集数据都是raw format的,里面不存储符号信息等。符号信息的映射是在另外机器上面完成的)
- As a result, the aggregated profiling overhead is negligible—less than 0.01 percent. At the same time, the derived profiles are still meaningful, as we show in the ‘‘Reliability analysis’’ section.(overhead没有超过1%)
2.2. Profiles and profiling interfaces
- GWP collects two categories of profiles: whole-machine and per-process.
- Whole- machine profiles capture all activities happening on the machine, including user applications, the kernel, kernel modules, daemons, and other background jobs. (收集机器上面的所有活动,包括应用程序,kernel,内核模块以及后台任务)
- The whole- machine profiles include hardware perfor- mance monitoring (HPM) event profiles, kernel event traces, and power measurements.
- Users without root access cannot directly invoke most of the whole-machine profiling systems, so we deploy lightweight daemons on every machine to let remote users (such as GWP collectors) access those profiles. The daemons act as gate keepers to control access, enforce sampling rate limits, and col- lect system variables that must be synchron- ized with the profiles.(机器上面部署服务可以让非root账号访问profile数据。并且这个daemon程序还可以和collector同步信息调整采样频率以及系统变量等)
- We use OProfile (http://oprofile.sourceforge.net) to collect HPM event profiles. OProfile is a system-wide profiler that uses HPM to gen- erate event-based samples for all running binaries at low overhead. To hide the hetero- geneity of events between architectures, we define some generic HPM events on top of the platform-specific events, using an approach similar to PAPI The most com- monly used generic events are CPU cycles, retired instructions, L1 and L2 cache misses, and branch mispredictions. We also provide access to some architecture-specific events. Although the aggregated profiles for those events are biased to specific architectures, they provide useful information for machine- specific scenarios.(使用OProfile来收集单机的事件信息。为了屏蔽各个机器的不同,为不同的平台定义了通用的HPM事件。通常比较关心的事件是CPU周期,完全执行完成的指令 http://software.intel.com/en-us/forums/topic/311170 ,L1,L2缓存以及分支预测等)
- In addition to whole-machine profiles, we collect various types of profiles from most applications running on a machine using the Google Performance Tools (http://code.google.com/p/google-perftools).(收集每个进程的profile信息是通过google-pertools来完成的)
- Most appli- cations include a common library that enables process-wide stacktrace-attributed profiling mechanisms for heap allocation, lock contention, wall time and CPU time, and other performance metrics. (通过stacktrace来做profiling,堆分配,锁冲突,时间以及其他性能指标)
- The com- mon library includes a simple HTTP server linked with handlers for each type of profiler. A handler accepts requests from remote users, activates profiling (if it’s not already active), and then sends the profile data back.(内置HTTP Server提供信息获取服务)
- Whole- machine profiles capture all activities happening on the machine, including user applications, the kernel, kernel modules, daemons, and other background jobs. (收集机器上面的所有活动,包括应用程序,kernel,内核模块以及后台任务)
2.3. Symbolization and binary storage
- After collection, the Google File System (GFS) stores the profiles To provide mean- ingful information, the profiles must corre- late to source code. However, to save network bandwidth and disk space, applica- tions are usually deployed into data centers without any debug or symbolic information, which can make source correlation impossi- ble.(profile存储在GFS上面,但是为了节省存储空间以及带宽,没有存放符号信息因此不能够和源代码对应起来)
- Furthermore, several applications, such as Java and QEMU, dynamically generate and execute code. The code is not available offline and can therefore no longer be sym- bolized. The symbolizer must also symbolize operating system kernels and kernel loadable modules.(对于QEMU以及Java这类程序来说因为是JIT的,所以非常难以将地址和符号联系起来。symbolizer还必须能够完成kernel以及kernel module的对应关系)
- Currently, GWP stores unstripped binaries in a global repository, which other services use to symbolize stack traces for automated failure reporting. Since the binaries are quite large and many unique binaries exist, symbolization for a single day of profiles would take weeks if run sequen- tially. To reduce the result latency, we dis- tribute symbolization across a few hundred machines using MapReduce.(现在实现方式是在一个中央存储中心存储所有的没有stripped的二进制版本,然后在MapReduce里面将这样的对应关系建立好)
2.4. Profile storage
- To make the data useful and accessible, we load the samples into a read-only dimensional data- base that is distributed across hundreds of machines. That service is accessible to all users for ad hoc queries and to systems for automated analyses.
- The database supports a subset of SQL- like semantics. Although the dimensional database is well suited to perform queries that aggregate over the large data set, some individual queries can take tens of seconds to complete. Fortunately, most queries are seen frequently, so the profile server uses ag- gressive caching to hide the database latency.(可以通过SQL来进行聚合查询)
2.5. User interfaces
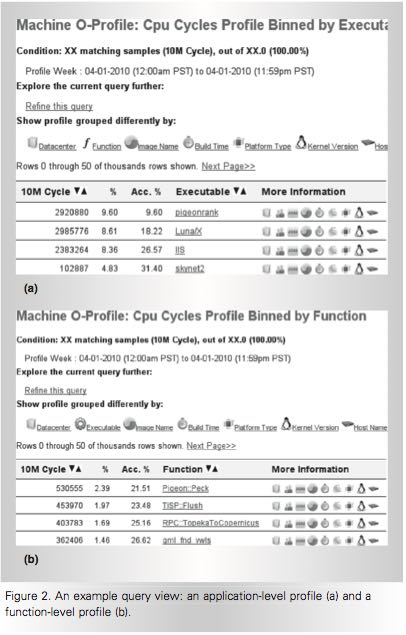
2.5.1. Query view
This page supplies links that let users refine the query to more specific data. For example, the user can restrict the query to only report samples for a specific executable collected within a desired time period. Additionally, the user can modify or refine any of the parameters to the current query to create a custom profile view.
2.5.2. Call graph view
2.5.3. Source annotation
2.5.4. Profile data API
We store both raw profiles and symbolized pro- files in ProtocolBuffer formats (http://code.google.com/apis/protocolbuffers). Advanced users can access and reprocess them using their preferred programming language.
2.6. Application-specific profiling
- Therefore, we provide an extension to GWP for application-specific profiling on the cloud. The machine pool for applica- tion-specific profiling is usually much smaller than GWP, so we can achieve a high sampling rate on those machines for the specific application. (对于特定应用进行profiling的话,是在GWP上进行扩展完成的,选取machine pool的数量也远少于之前每次选取的machine数量,然后在这些机器上面进行高频率的采样)
- Application-specific profiling is generic and can target any specific set of machines. For example, we can use it to profile a set of machines deployed with the newest kernel version. We can also limit the profiling dura- tion to a small time period, such as the appli- cation’s running time. It’s useful for batch jobs running on data centers, such as MapRe- duce, because it facilitates collecting, aggre- gating, and exploring profiles collected from hundreds or thousands of their workers.
3. Reliability analysis
4. Profile uses
- Note that the sample must be numeric and capable of aggregation. The associated vector contains information such as application name, function name, platform, compiler version, image name, data center, kernel information, build revi- sion, and builder’s name. Assuming that the vector contains m elements, we can rep- resent a record GWP collected as a tuple <event, sample counter, m-dimension vector>.(数据存储方式,每个event对应的计数上存在多个维度,包括应用程序,函数,平台,编译器版本,映像,数据中心,内核,构建版本和构建人等)
- When aggregating, GWP lets users choose k keys from the m dimensions and groups the samples by the keys. Basically, it filters the samples by imposing one or more restrictions on the rest of the dimen- sions (m-k) and then projects the samples into k key dimensions. (用户选择其中k个维度,然后将剩余维度进行聚合。当然在剩余的维度里面一些数据可能是没有意义的也会被过滤掉)
- GWP finally displays the sorted results to users, delivering answers to various performance queries with high confidence. Although not every query makes sense in practice, even a small subset of them are demonstrably informative in identifying performance issues and providing insights into computing resources in the cloud.
4.1. Cloud applications’ performance
4.1.1. Finding the hottest shared code
4.1.2. Evaluating hardware features
The low-level information GWP provides about how CPU cycles (and other machine resources) are spent is also used for early evaluation of new hardware features that datacenter operators might want to introduce.
4.2. Optimizing for application affinities
- Some applications run better on a partic- ular hardware platform due to sensitivity to architectural details, such as processor micro- architecture or cache size. It’s generally very hard or impossible to predict which applica- tion will fare best on which platform. In- stead, we measure an efficiency metric, CPI, for each application and platform com- bination. We can then improve job schedul- ing so that applications are scheduled on platforms where they do best, subject to availability.(一些应用程序可能在某些机器硬件上面执行效率更好,因为CPU架构或者是cache size等)
- The example in Table 1 shows how the total number of cycles needed to run a fixed number of instructions on a fixed machine capacity drops from 500 to 400 using preferential scheduling. Specifi- cally, although the application NumCrunch runs just as well on Platform1 as on Plat- form2, application MemBench does poorly on Platform2 because of the smaller L2 cache. Thus, the scheduler should give Mem- Bench preference to Platform1.
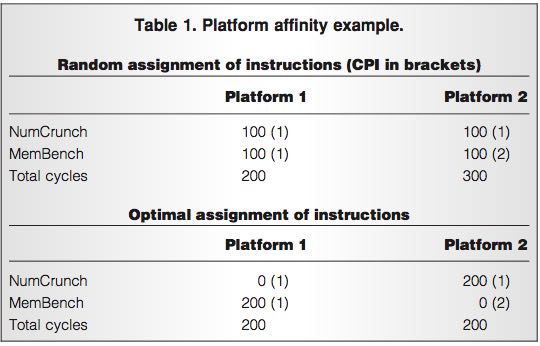
- We use a simulated annealing solver that approximates the optimal solution in seconds for workloads of around 100 jobs running on thousands of machines of four different platforms over one month. Although appli- cation developers already mapped major applications to their best platform through manual assignment, we’ve measured 10 to 15 percent potential improvement in most cases where many jobs run on multiple plat- forms. Similarly, users can use GWP data to identify how to colocate multiple applica- tions on a single machine to achieve the best throughput.(本质上这个问题是一个多约束优化问题,使用退火算法计算出了一个近似解决方案,然后通过人工assignment,发现在某些case下面提高10-15%的效率)