Dapper, a Large-Scale Distributed Systems Tracing Infrastructure
Table of Contents
- http://research.google.com/pubs/pub36356.html @ 2010
- http://duanple.blog.163.com/blog/static/70971767201329113141336/
1. Abstract
Modern Internet services are often implemented as com- plex, large-scale distributed systems. These applications are constructed from collections of software modules that may be developed by different teams, perhaps in different programming languages, and could span many thousands of machines across multiple physical facili- ties. Tools that aid in understanding system behavior and reasoning about performance issues are invaluable in such an environment.(现代互联网服务底层都是复杂的,大规模的分布式系统, 由很多组件模块组成。而这些组件模块都是由不同的开发团队开发的,甚至使用不同语言完成的,并且有可能分布式很多机器上。在这样的环境下面,有工具能够帮助理解系统行为并且对性能问题进行解释分析是非常有帮助的)。 Dapper就是这样一个追踪系统,能够追踪到各个模块之间相互调用关系,这些调用关系可能是跨越服务,跨越机器的。通过这种追踪系统就能够在比较高的层面上分析问题和理解系统
2. Introduction
- An engineer looking only at the overall latency may know there is a problem, but may not be able to guess which service is at fault, nor why it is behaving poorly. (系统复杂的时候比较难以分析性能开销和瓶颈在什么地方)
- First, the engineer may not be aware precisely which services are in use; new services and pieces may be added and modi- fied from week to week, both to add user-visible features and to improve other aspects such as performance or se- curity.
- Second, the engineer will not be an expert on the internals of every service; each one is built and main- tained by a different team.
- Third, services and machines may be shared simultaneously by many different clients, so a performance artifact may be due to the behavior of another application.
- The scenario described above gives rise to two funda- mental requirements for Dapper: ubiquitous deployment, and continuous monitoring.(上面场景给Dapper提出了两点要求)
- Ubiquity is important since the usefulness of a tracing infrastructure can be severly impacted if even small parts of the system are not be- ing monitored.(首先需要广泛部署,因为如果某个组件没有被监控的话,那么整个trace的意义就收到了很大的影响)
- In addition, monitoring should always be turned on, because it is often the case that unusual or otherwise noteworthy system behavior is difficult or im- possible to reproduce. (整个监控过程必须是一直打开的,主要就是为了监控一些异常事件,而这些异常事件的触发是我们不可预知的)
- Three concrete design goals result from these requirements:
- Low overhead: the tracing system should have neg- ligible performance impact on running services. In some highly optimized services even small monitor- ing overheads are easily noticeable, and might com- pel the deployment teams to turn the tracing system off.(追踪代价必须足够小)
- Making the system scalable and reducing perfor- mance overhead was facilitated by the use of adaptive sampling(扩展和低开销通过采样来完成)
- Application-level transparency: programmers should not need to be aware of the tracing system. A tracing infrastructure that relies on active collab- oration from application-level developers in order to function becomes extremely fragile, and is often broken due to instrumentation bugs or omissions, therefore violating the ubiquity requirement. This is especially important in a fast-paced development environment such as ours.(应用层必须足够透明。这也要求在代码层面上如果出现bug要不能够影响现有系统正常运行)
- True application-level transparency, possibly our most challenging design goal, was achieved by restricting Dapper’s core tracing instrumentation to a small corpus of ubiquitous threading, control flow, and RPC library code. (在library级别上做一些事情来达到透明性)
- Scalability: it needs to handle the size of Google’s services and clusters for at least the next few years.(扩展性,因为google里面的大部分服务都已经是具备良好的扩展性了的)
- An additional design goal is for tracing data to be available for analysis quickly after it is generated: ide- ally within a minute. Although a trace analysis system operating on hours-old data is still quite valuable, the availability of fresh information enables faster reaction to production anomalies.(对于tracing分析的结果要尽可能实时,最好是分钟级别的,这样适合最更加快速的分析)
- The re- sulting system also includes code to collect traces, tools to visualize them, and libraries and APIs (Application Programming Interfaces) to analyze large collections of traces.(整个系统还需要包括收集追踪数据,可视化工具以及库和API来分析这些追踪)
- Low overhead: the tracing system should have neg- ligible performance impact on running services. In some highly optimized services even small monitor- ing overheads are easily noticeable, and might com- pel the deployment teams to turn the tracing system off.(追踪代价必须足够小)
3. Distributed Tracing in Dapper
A tracing infrastructure for distributed services needs to record information about all the work done in a sys-tem on behalf of a given initiator. A simple yet useful distributed trace for this request would be a collection of message identifiers and timestamped events for every message sent and received at each server.
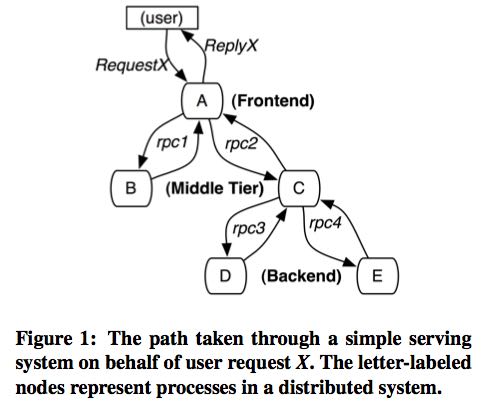
Two classes of solutions have been proposed to ag- gregate this information so that one can associate all record entries with a given initiator (e.g., RequestX in Figure 1), black-box and annotation-based monitoring schemes.(有两种办法可以将所有的记录和initiator联系起来,这样就知道某个请求是谁发送的)
- Black-box schemes assume there is no additional information other than the message record described above, and use statistical regression techniques to infer that association.(黑盒方案就是假设所有的record都没有附加信息,通过统计回归技术建立关联)
- While black-box schemes are more portable than annotation-based methods, they need more data in order to gain sufficient accuracy due to their reliance on sta- tistical inference.(需要一定的历史数据来建立这种关联)
- Annotation-based schemes rely on applications or middleware to explicitly tag every record with a global identifier that links these message records back to the originating re- quest. (而基于标注的办法就需要在record上面标明号GID, 这样通过GID将所有的信息联系起来)
- The key disadvantage of annotation- based methods is, obviously, the need to instrument pro- grams. (需要应用程序额外提供一些信息,影响了透明性)
- In our environment, since all applications use the same threading model, control flow and RPC system, we found that it was possible to restrict instrumentation to a small set of common libraries, and achieve a monitor- ing system that is effectively transparent to application developers.(但是因为将dapper封装成为library, 所以可以限制这种对透明性的影响)
3.1. Trace trees and spans
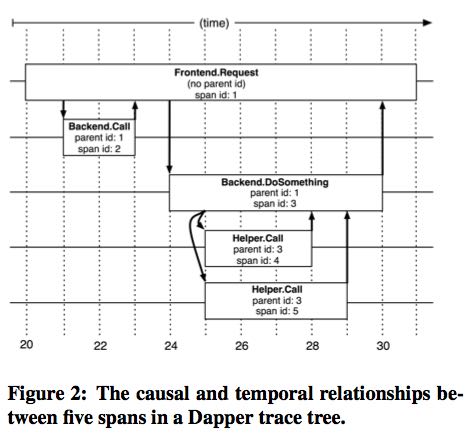
- In a Dapper trace tree, the tree nodes are basic units of work which we refer to as spans.(每个活动都称为一个span)
- The edges indicate a casual relationship between a span and its parent span.
- Independent of its place in a larger trace tree, though, a span is also a simple log of timestamped records which encode the span’s start and end time, any RPC timing data, and zero or more application-specific annotations(span里面记录了起始和终止时间,并且附带了其他一些来自应用程序的注解信息)
- Dapper records a human-readable span name for each span, as well as a span id and parent id in order to reconstruct the causal relationships between the individual spans in a single distributed trace. (每个span上面还能够附带一个span name方便阅读,并且带上span id以及parent id这样可以方便建立起关系)Spans created without a parent id are known as root spans.
- All spans associated with a specific trace also share a com- mon trace id (not shown in the figure). All of these ids are probabilistically unique 64-bit integers.(每次trace都会带上一个概率上唯一的trace id)
3.2. Instrumentation points
- Dapper is able to follow distributed control paths with near-zero intervention from application developers by re- lying almost entirely on instrumentation of a few com- mon libraries:
- When a thread handles a traced control path, Dap- per attaches a trace context to thread-local storage. A trace context is a small and easily copyable con- tainer of span attributes such as trace and span ids.(trace context绑定到了thread-local storage)
- When computation is deferred or made asyn- chronous, most Google developers use a com- mon control flow library to construct callbacks and schedule them in a thread pool or other executor. Dapper ensures that all such callbacks store the trace context of their creator, and this trace con- text is associated with the appropriate thread when the callback is invoked. In this way, the Dapper ids used for trace reconstruction are able to follow asynchronous control paths transparently.(采用异步调用的话那么callback会绑定其creator的context)
- Nearly all of Google’s inter-processcommunication is built around a single RPC framework with bind- ings in both C++ and Java. We have instrumented that framework to define spans around all RPCs. The span and trace ids are transmitted from client to server for traced RPCs. For RPC-based systems like those in wide use at Google, this is an essential instrumentation point. We plan to instrument non- RPC communication frameworks as they evolve and find a user base.(几乎所有的google进程间通信都是使用了RPC框架,我们可以直接在RPC框架里面就带上trace功能)
3.3. Annotations
- The instrumentation points described above are sufficient to derive detailed traces of complex distributed systems, making the core Dapper functionality available to otherwise unmodified Google applications. However, Dapper also allows application developers to enrich Dapper traces with additional information that may be useful to monitor higher level system behavior or to help in debugging problems.(annotation能够更方面了解系统行为和定位问题,但是不是核心功能)
- In order to protect Dapper users from accidental overzealous logging, individual trace spans have a con-figurable upper-bound on their total annotation volume. Application-level annotations are not able to displace the structural span or RPC information regardless of application behavior(为了防止用户滥用dapper随意进行logging, 在单个trace下面的spans是有annotation数量上限的,并且应用程序的annotation不能够代替框架annotation)
- In addition to simple textual annotations, Dapper also supports a map of key-value annotations that give developers more tracing power, such as maintaining counters, logging binary messages, and transporting arbitrary userdefined data along with a traced request within a process. These key-value annotations are used to define application-specific equivalence classes within the context of distributed traces.(annotation以keyvalue形式进行存储和访问)
3.4. Sampling
- Low overhead was a key design goal for Dapper, since service operators would be understandably reluctant to deploy a new tool of yet unproven value if it had any significant impact on performance.
- Therefore, besides making the basic instrumentation overhead of Dapper collection as small as possible, we further control overhead by recording only a fraction of all traces.
3.5. Trace collection
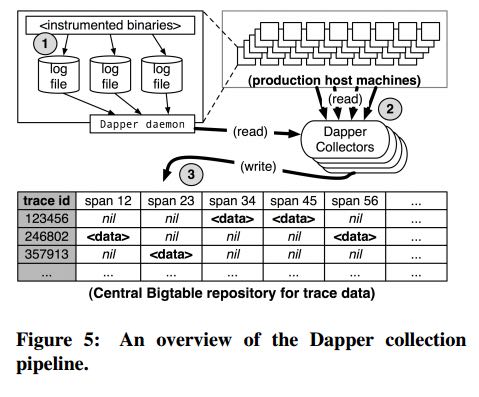
- The Dapper trace logging and collection pipeline is a three-stage process
- First, span data is written (1) to local log files.
- It is then pulled (2) from all production hosts by Dapper daemons and collection infrastructure
- and finally written (3) to a cell in one of several regional Dapper Bigtable repositories.
- A trace is laid out as a single Bigtable row, with each column corresponding to a span.(每个trace对应一个row, 然后span对应里面的column)
- The median latency for trace data collection – that is, the time it takes data to propagate from instrumented application binaries to the central repository – is less than 15 seconds. (平均每个trace时间都是在15s内可以到达central reposiroty的)
- The 98th percentile latency is itself bimodal over time; (percentile 98%延迟是有双峰性的)
- approximately 75% of the time, 98th percentile collection latency is less than two minutes, (75%时间里面,98%延迟是在2min一下)
- but the other approximately 25% of the time it can grow to be many hours.(25%时间里面,98%延迟在小时级别上)
- The Dapper system as described performs trace logging and collection out-of-band with the request tree itself. This is done for two unrelated reasons.(为什么选择out-of-band collection的方式)
- First, an in-band collection scheme – where trace data is sent back within RPC response headers – can affect application network dynamics.(使用in-band方式会影响到application网络本身) In many of the larger systems at Google, it is not uncommon to find traces with thousands of spans. However, RPC responses – even near the root of such large distributed traces – can still be comparatively small: often less than ten kilobytes. In cases like these, the inband Dapper trace data would dwarf the application data and bias the results of subsequent analyses.
- Secondly, in-band collection schemes assume that all RPCs are perfectly nested. We find that there are many middleware systems which return a result to their caller before all of their own backends have returned a final result. An in-band collection system is unable to account for such non-nested distributed execution patterns.(in-band collection方式假设RPC调用都是嵌套的,但是实际上不是如此。有可能发起调用之后并没有同步返回,这样情况in-band collection方式处理不了)
3.6. Security and privacy considerations
4. Dapper Deployment Status
4.1. Dapper runtime library
- Perhaps the most critical part of Dapper’s code base is the instrumentation of basic RPC, threading and control flow libraries, which includes span creation, sampling, and logging to local disks.
- Besides being lightweight, this code needs to be stable and robust since it is linked into a vast number of applications, making maintenance and bug fixing difficult.(轻量并且代码需要足够稳定)
- The core instrumentation is less than 1000 lines of code in C++ and under 800 lines in Java. The implementation of key-value annotations adds an additional 500 lines of code.(整个instrumentation代码还是相对来说比较少的)
4.2. Production coverage
- Dapper penetration can be assessed in two dimensions: the fraction of production processes that can generate Dapper traces (i.e., those that are linked with Dapperinstrumented runtime libraries) and the fraction of production machines running Dapper’s trace collection daemon.(Dapper覆盖包括两个方面,一个是在application process里面使用runtime library部分,一个是在server上面部署daemon部分)
- Dapper’s daemon is part of our basic machine image, making it present on virtually every server at Google.
- It is difficult to determine the precise fraction of Dapper-ready processes since processes generating no trace information are invisible to Dapper. However, given how ubiquitous Dapper-instrumented libraries are, we estimate that nearly every Google production process supports tracing.
4.3. Use of trace annotations
- 41 Java and 68 C++ applications have added custom application annotations in order to better understand intra-span activity in their services.
- It is worth noting that our Java developers who have adopted the anno tation API have made more annotations per span than their C++ counterparts thus far. This may be because our Java workloads tend to be closer to the end user; these sorts of applications often handle a wider mix of requests and consequently have comparatively complex control paths.(对于更加面向end-user的application来说,更有可能使用annotation)
5. Managing Tracing Overhead
5.1. Trace generation overhead
- Trace generation overhead is the most critical segment of Dapper’s performance footprint, since collection and analysis can more easily be turned off in an emergency.(对于collection以及analysis都能够在紧急情况下面关闭)
- The most important sources of trace generation overhead in the Dapper runtime libraries are creating and destroying spans and annotations, and logging them to local disk for subsequent collection.(包括产生和销毁span对象和annotation, 以及logging到磁盘上)
- Root span creation and destruction takes 204 nanoseconds on average. while the same operation for non-root spans takes 176 nanoseconds. The difference is the added cost of allocating a globally unique trace id for root spans.(root span开辟需要204ns, non-root span开辟需要176ns,差别在于root span需要allocate trace id)
- The cost of additional span annotations is almost negligible if the span is not sampled for tracing, consisting of a thread-local lookup in the Dapper runtime, averaging about 9 nanoseconds. If it is sampled, annotating the trace with a string literal – much like what’s shown in Figure 4 – costs 40 nanoseconds on average. These measurements were made on a 2.2GHz x86 server.(thread-local lookup占用9ns,log annotation占用40ns)
- Writes to local disk are the most expensive operation in Dapper’s runtime library, but their visible overhead is much reduced since each disk write coalesces multiple log file write operations and executes asynchronously with respect to the traced application. Nevertheless, log write activity can have a perceptible impact on highthroughput application performance, especially if all requests are being traced.(磁盘可以通过聚合以及异步写来减少影响)
5.2. Trace collection overhead
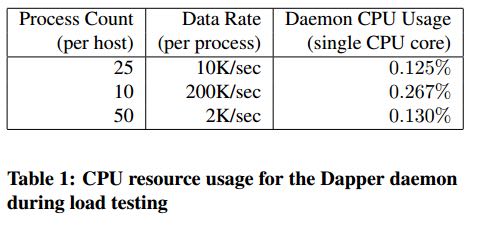
- The daemon never uses more than 0:3% of one core of a production machine during collection, and has a very small memory footprint (within the noise of heap fragmentation). We also restrict the Dapper daemon to the lowest possible priority in the kernel scheduler in case CPU contention arises within a heavily-loaded host machine.
- Dapper is also a light consumer of network resources, with each span in our repository corresponding to only 426 bytes on average. Taken as a fraction of the network activity in the applications we’re monitoring, Dapper trace data collection is responsible for less than 0:01% of the network traffic in Google’s production environment.
5.3. Effect on production workloads
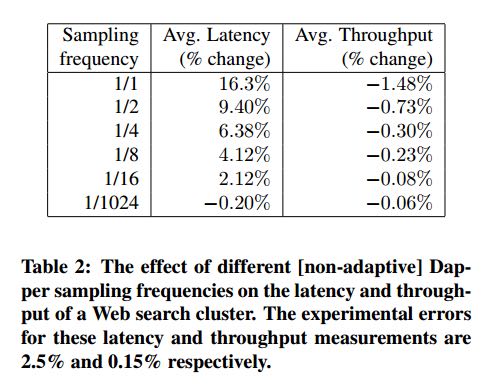
- We see that although the impact on throughput is not very significant, in order to avoid noticeable latency degradation, trace sampling is indeed necessary.(做采样还是必须的)
- However, the latency and throughput penalties associated with sampling frequencies less than 1/16 are all within the experimental error. In practice, we have found that there is still an adequate amount of trace data for high-volume services when using a sampling rate as low as 1/1024.(即使使用1/1024采样概率的话依然存在许多分析数据)
- Using a lower sampling frequency has the added benefit of allowing data to persist longer on the local disks of host machines before being garbage-collected, which gives more flexibility to the collection infrastructure.(同样低采样允许在磁盘上面存放更多的数据)
5.4. Adaptive sampling
- The Dapper overhead attributed to any given process is proportional to the number of traces that process samples per unit time.
- The first production version of Dapper used a uniform sampling probability for all processes at Google, averaging one sampled trace for every 1024 candidates. This simple scheme was effective for our high-throughput online services since the vast majority of events of interest were still very likely to appear often enough to be captured.(初始版本使用的是1/1024采样率,这个简单的方式足够高吞吐的在线服务得到许多有价值的数据)
- However, lower traffic workloads may miss important events at such low sampling rates, while tolerating higher sampling rates with acceptable performance overheads. The solution for such systems is to override the default sampling rate, which requires the kind of manual intervention that we sought to avoid in Dapper. (但是对于低负载应用使用低采样率的话,会错过许多事件。因为本身低负载本身触发的事件就不多,如果再进行采样的话会失真比较严重。当时解决的办法是人工调整采样频率)
- We are in the process of deploying an adaptive sampling scheme that is parameterized not by a uniform sampling probability, but by a desired rate of sampled traces per unit time. This way, workloads with low traffic automatically increase their sampling rate while those with very high traffic will lower it so that overheads remain under control. The actual sampling probability used is recorded along with the trace itself; this facilitates accurate accounting of trace frequencies in analytical tools built around Dapper data.(指定在一段时间的采样数目,这样在高吞吐的时候就会使用低频采样,而在低负载的时候使用高频采样。采样率本身也会存储在trace里面并且后续也可以分析出来)
5.5. Coping with aggressive sampling
5.6. Additional sampling during collection
- The sampling mechanisms described above were designed to minimize perceptible overhead in applications which incorporate the Dapper runtime library. The Dapper team also needs to control the total size of data written to its central repositories, though, and thus we incorporate a second round of sampling for that purpose. (之前sampling的机制主要是用来减少instruct的overhead. 但是Dapper为了控制数据总量,在collection阶段还会进行一次sampling)
- Our production clusters presently generate more than 1 terabyte of sampled trace data per day. Dapper users would like trace data to remain available for at least two weeks after it was initially logged from a production pro- cess.(每天产生1TB数据,而用户通常需要观察最近两周的数据)
- The benefits of increased trace data density must then be weighed against the cost of machines and disk storage for the Dapper repositories. Sampling a high fraction of requests also brings the Dapper collectors un- comfortably close to the write throughput limit for the Dapper Bigtable repository.(如果后期采样密度高的话会接近bigtable的极限)
- In order to maintain flexibility around both the mate- rial resource requirements and the cumulative Bigtable write throughput, we added support for additional sam- pling in the collection system itself.
- We leverage the fact that all spans for a given trace – though they may be spread across thousands of distinct host machines – share a common trace id. (根据trace id进行聚合)
- For each span seen in the col- lection system, we hash the associated trace id as a scalar z, where 0 ≤ z ≤ 1. If z is less than our collection sam- pling coefficient, we keep the span and write it to the Bigtable. Otherwise, we discard it.(然后将trace id转换成为标量z,然后根据z判断是否小于某个系数。如果小于某个系数的话,那么就保留否则就丢弃)
- By depending on the trace id for our sampling decision, we either sam- ple or discard entire traces rather than individual spans within traces. (使用trace id做聚合这样可以保存完整的trace)
- We have found that this additional config- uration parameter makes the administration of our col- lection pipeline much simpler, as we can easily adjust our global write rate by changing a single parameter in a configuration file.(使用参数配置的话可以使得管理更加容易)
- It would be simpler if there was only one sampling pa- rameter for the entire tracing and collection system, but it is not feasible to quickly adjust the runtime sampling configuration in all deployed binaries.(没有使用单个sampling参数的原因,是因为这样不容易适用于所有的二进制上。虽然这样更加简单)
- We have chosen a runtime sampling rate which yields slightly more data than we can write to our repositories,
- and we throttle that write rate with the secondary sampling coefficient in the collection system.
- Dapper pipeline maintenance is easier since we can augment or diminish our global coverage and write-rate immediately with a single change to our secondary sampling configuration.
6. General-Purpose Dapper Tools
6.1. The Dapper Depot API
- The Dapper “Depot API,” or DAPI, provides direct ac- cess to the distributed trace records in the regional Dap- per repositories (or “Depots”). The DAPI and the Dap- per trace repositories were designed in tandem, and the DAPI is meant to expose a clean and intuitive interface to the raw data contained within these Dapper reposito- ries.( API以及repository的设计是同时进行的,使得API能够很容易地访问到收集到的原始数据)Our use cases suggested the following three ways to access trace data:
- Access by trace id: The DAPI can load any trace on demand given its globally unique trace id.(按照trace id来进行访问)
- Bulk access: The DAPI can leverage MapReduce to pro- vide access to billions of Dapper traces in parallel. The user overrides a virtual function which accepts a Dapper trace as its only argument, and the framework will in- voke that function once for every collected trace within a user-specified time window.(覆盖虚函数参数是单个trace)
- Indexed access: The Dapper repositories support a sin- gle index which has been chosen to match our com- mon access patterns. This index maps from commonly- requested trace features (described below) to distinct dapper traces. Since trace ids are allocated pseudo- randomly, this is the best way to quickly access traces associated with a specific service or host machine.(在bigtable上建立索引,索引特征是某些特定的特征。考虑到trace id是近似随机分配的,使用index访问可能是最合适的方式)
- The choice of an appropriate custom index was the most challenging aspect of the DAPI design. (如何选择合适的索引)
- The com- pressed storage required for an index into the trace data is only 26% less than for the actual trace data itself, so the costs are significant. (索引占用大小不会超过原始数据量的26%,所以开销本身不是很大)
- Initially, we deployed two in- dices: one index for host machines, and one for service names. However, we did not find sufficient interest in the machine-based indices to justify their storage cost. When users were interested in individual machines, they were also interested in a specific service, so we eventu- ally combined the two into a composite index which al- lows for efficient lookup by service name, host machine, and timestamp, in that order.(开始的时候只是针对host和service name进行索引,但是后来发现用户即使对host做查询但是也会向了解是使用什么服务,所以最后索引顺序是service name, host machine, timestamp)